Bollinger Bands As a Combination of Trend and Volatility
Bollinger Bands are one of the most widely used tools in technical analysis. This tool offers traders valuable information about price trends and market volatility. Bollinger Bands visualize price movement around a central moving average and outer bands. With it, this tool helps traders to identify points to exit and enter trades, see what conditions are in the market, and make better decisions.
If you want to use Bollinger Bands effectively, you need to understand how they work. Let’s check it.
Each Bollinger Band consists of three components:
- A middle band, which is typically a simple moving average (SMA)
- Two outer bands that represent standard deviations above and below the SMA.
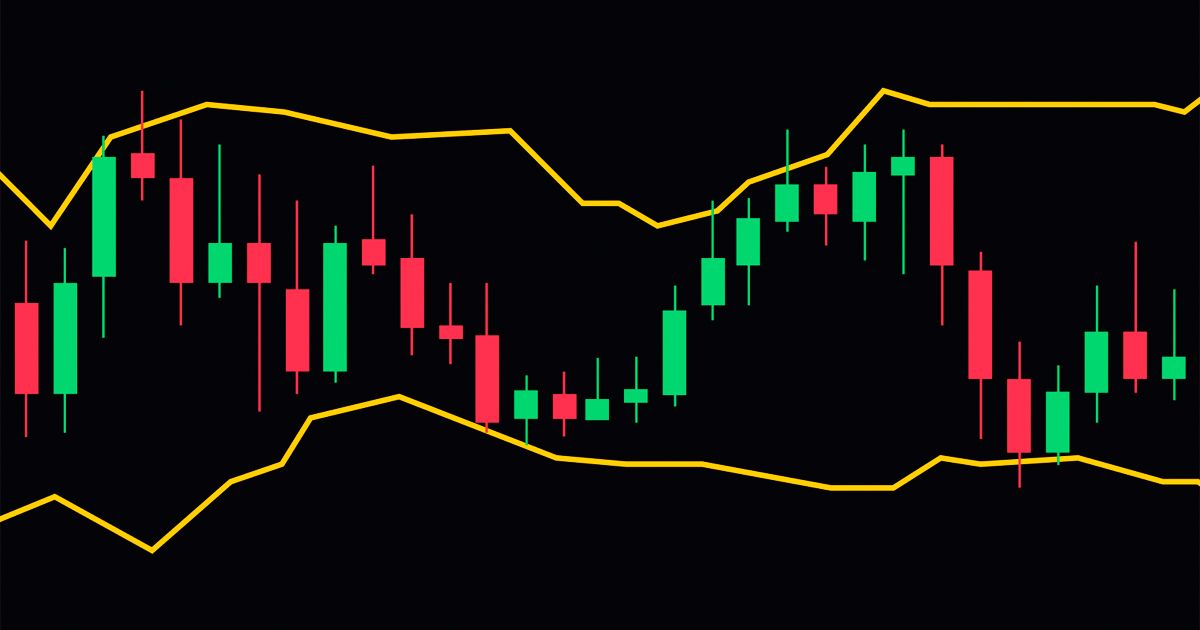
The distance between the bands changes depending on the market volatility. When the volatility is high, the bands widen. And when the volatility is low, the band narrows. This is how traders can see whether there are quick price changes and place trades accordingly.
When the price approaches the upper band, it means that the asset is overbought. And when the price moves to the lower band, it shows that the asset may be oversold.
Bollinger Bands do not provide exact buy or sell signals. This is why you shall use them in combination with other indicators and add price action analysis. For example, if the price goes above the upper band and there is a strong uptrend, then, the trend may continue.
Bollinger Bands can also help you to see when there is market compression. When the bands contract, the volatility is low, and there may be a breakout. You can see when price movements are coming, and you can get ready for this.
Bollinger Bands also can help you to identify trends. If the price tries to cross the upper band, there is an uptrend. And during the downtrend, the price moves to the lower band. If you know how to observe the price movements, you can see where the market is moving and adjust your strategy. You can also combine this indicator with momentum indicators and volume indicators to confirm your guesses.
Bollinger Bands are a very good tool. They help to see the market trends and volatility level. This is how you can make more accurate trading decisions.
Trend and Volatility
One of the main advantages of Bollinger Bands is that they not only show the trend but also show the volatility. Many indciators focus on price only or on market volatility, and this is why Bollinger Bands is very important, because it visualizes both.
The middle SMA band represents the general trend. It can help you determine whether an asset is in an uptrend, downtrend, or sideways market. The outer bands expand and contract based on standard deviation. It gives you a clear image about the market volatility. This all can help you to adapt your strategy to changing market conditions.
You can follow the bands to assess the market momentum. For example, if the price comes close to the upper band during an uptrend, it indicates strong buying pressure, and it means that the trend may continue. And on the contrary, if the price comes close to a lower trend during a downtrend, it shows that there is a selling pressure. Sudden moves away from the bands may suggest trend exhaustion or upcoming reversals and providence very important signals to help you create the right strategy.
If you know how analyze volatility and Bollinger Bands to manage risks properly. Ifnthe bands are wider, the price may change even more. And this means that you will need to adjust your positions in size and place stop-losses. If the bands a narrow, and the volatility is low, it shows that there may be a breakout. This combination allows traders to adjust strategies to both trending and range-bound markets.
Bollinger Band technical analysis also helps to identify overextended market conditions. When the price moves sharply away from the middle band and touches or pierces the outer band, it can signal that the asset is temporarily overbought or oversold. You can also check whether the confirmations are, such as trendline breaks, candlestick reversals, and adjust your positions accordingly.
You can combine trend and volatility indicators, Bollinger Bands, and adjust your approach according to the current market.
What to Beware of in Bollinger Bands
The Bollinger Band indicator offers valuable information, but it is important to understand also their cons and limitations. First, it is not a standalone signal generator. When the price touches or crosses the bands, it doesn’t necessarily mean that there will be a reversal. You shall see the broader context and check also trend strength, volume, and other indicators.
Highly volatile markets are known for false signals. During such conditions, prices may temporarily break the bands, but the trend may not develop as expected. So, if you rely only on Bollinger Bands, you may enter the trades earlier than needed, set stop-losses incorrectly, and lose money.
Another problem is lag. Bollinger Bands use moving averages, and they reflect historical prices. This is why there may be slight delays with signals about trends and volatility changes. This is why always combine the bands with leading indicators, such as RSI or MACD,. This can help compensate for the lag and provide much more reliable information about the market.
Be very careful when there is low volatility. Narrow bands may precede a breakout, and it may be very difficult to predict the direction. If you don’t see any confirmation, you may place wrong trends and lose your money.
Additionally, if you overrely on Bollinger Bands, you may not notice some market news or other factors that can lead to sudden volatility. For example, when there economic announcements or geopolitical events, they can invalidate signals and change the entire situation in the market.
What Is Bollinger Bands?
Bollinger Bands are a set of three lines that form an envelope around price action. The central line is typically a 20-period simple moving average, and the upper and lower bands are calculated using standard deviations from the SMA. This setup enables traders to see both the trend and the volatility at the same time.
Bollinger Bands were developed by John Bollinger in the 1980s. Since then, the tool has become very important in technical analysis due to its adaptability and simplicity. Bollinger Bands are widely used in forex, stocks, commodities, and cryptocurrency markets and help to identify potential overbought or oversold conditions and assess market volatility.
The distance between the bands show the price volatility. When the distance is bigger, the volatility is higher. When the distance is smaller, the volatility is lower. This helps you to see how the market moves and place your trades correctly.
Bollinger Bands also help visualize trends. When the price consistently touches or rides along the upper band, it signals a strong uptrend. And on the contrary, if the price gets closer to the lower band, it may indicate a coming downtrend. If the price moves sharply from the bands, check other indicators to understand better what is going on.
Another important feature of Bollinger Bands is their ability to identify market squeezes. A “squeeze” occurs when the bands contract tightly, and signals a period when the volatility is low. When you see such a squeeze, get ready for the strong directional moves and then, a breakout may come.
You can incorporate Bollinger Bands into a lot of strategies. With it, you can measure volatility, determine trends, and use it for all types of trading, such as day trading, swing trading, and even for long-term investing.
What Are The Benefits of Bollinger Bands?
The main advantages of Bollinger Bands is that they combine the trend and volatility information.
They give very clear signals about whether conditions are overbought or oversold; this way, they can help you identify buying and selling points. You can better see the market trends and prepare for market reversals.
Another benefit of Bollinger Bands is adaptability. The bands adjust to market conditions that always change, and demonstrate it when they widen or narrow. This helps you to use this indicator for all possible assets, in all timeframes, including very small charts and daily charts.
Bollinger Bands can help you to enhance risk management. Wider bands signal higher potential price swings. It means that you'd better adjust stop-loss levels and position sizes accordingly.
Narrow bands indicate periods of consolidation, and it means that a breakout may be coming. You may want to plan your entries with better risk-reward ratios.
You shall combine Bollinger Bands with other indicators, this will help you to make better decisions. For example, if you pair Bollinger Bands with RSI, you can see overbought or oversold conditions, and if you combine it with MACD, you can confirm trend continuation or reversal signals.
Bollinger Bands simplify market analysis a lot. You do not have to study multiple charts and indicators; instead, you can quickly assess trend and volatility in one tool that is easy to use. This clarity helps improve efficiency, confidence, and discipline in trading decisions.
Bollinger Bands can be used in different market conditions. If the market is trending, they can confirm momentum and identify pullbacks for strategic entries. If the market is ranging, the bands provide potential buy or sell zones near the lower and upper bands. This dual utility makes them an efficient tool for any trader’s toolkit.
The benefits of Bollinger Bands include trend identification, volatility measurement, risk management, versatility across markets, and ease of use. This is a very good tool that helps you to be informed and to optimize your strategies in any market condition.