
Best TradingView Indicators at a Glance
| Question | Answer |
|---|---|
| How many built in indicators does TradingView offer? | Over 100 technical indicators available on all plan tiers |
| How many community indicators exist? | More than 150,000 Pine Script community scripts, half open source |
| How many indicators can free users add to one chart? | Two indicators per chart on the free plan |
| What are the main indicator categories? | Trend, momentum, volatility, and volume |
| Does TradingView support custom indicator creation? | Yes, through the Pine Script v6 programming language |
| Which plan allows the most indicators per chart? | The Ultimate plan supports up to 25 indicators per chart |
Top 8 Indicators on TradingView Every Trader Should Know
The platform gives traders access to over 100 built in tools and a growing community library of 150,000+ scripts. These eight tradingview indicators are the most widely used across day trading, swing trading, and position trading. Each one fills a specific role in technical analysis, from identifying trends to managing risk.
Moving Averages (SMA and EMA) for Trend Direction
A moving average smooths price data into a single line that reveals the overall trend. The Simple Moving Average (SMA) calculates the mean closing price over a set number of periods. The Exponential Moving Average (EMA) gives more weight to recent prices and reacts faster to new data.
Traders watch for crossover signals between two averages. When the 50 period MA crosses above the 200 period MA, it forms a "golden cross" signal. The reverse pattern, known as a "death cross," warns of downward momentum.
Moving averages also serve as dynamic support and resistance levels on any timeframe.
Relative Strength Index (RSI) for Momentum
The RSI tracks price speed and magnitude on a scale from 0 to 100. Readings above 70 indicate that an asset may be overbought. Readings below 30 suggest oversold conditions.
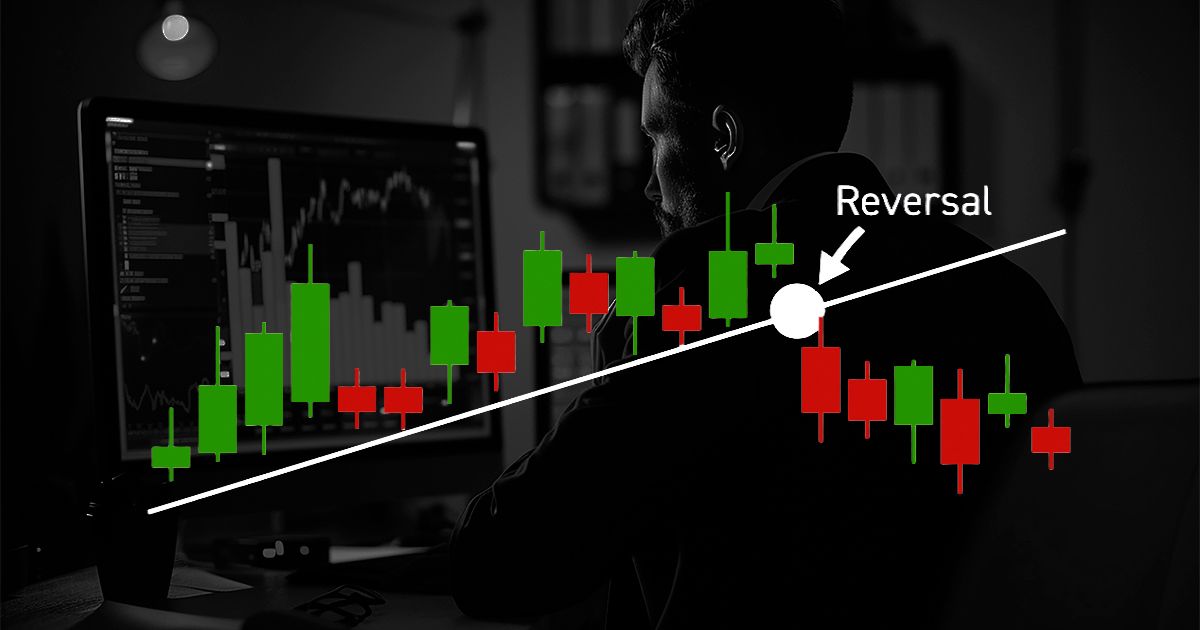
A rising price paired with a falling RSI often reveals a weakening trend. This type of divergence gives early warning before a reversal happens. The standard setting uses 14 periods, but shorter settings suit faster trading styles.
The best indicator on TradingView for momentum confirmation in most setups is RSI paired with a trend tool like a moving average.
MACD for Trend Strength and Reversals
MACD stands for Moving Average Convergence Divergence. It measures the gap between a 12 period EMA and a 26 period EMA, then plots a signal line and a histogram.
When the MACD line crosses above the signal line, bullish momentum builds. A crossover below the signal line points to bearish pressure. The histogram bars grow taller as the move gains strength and shrink as it fades.
This tool works best on 1 hour, 4 hour, and daily charts for catching trend shifts early.
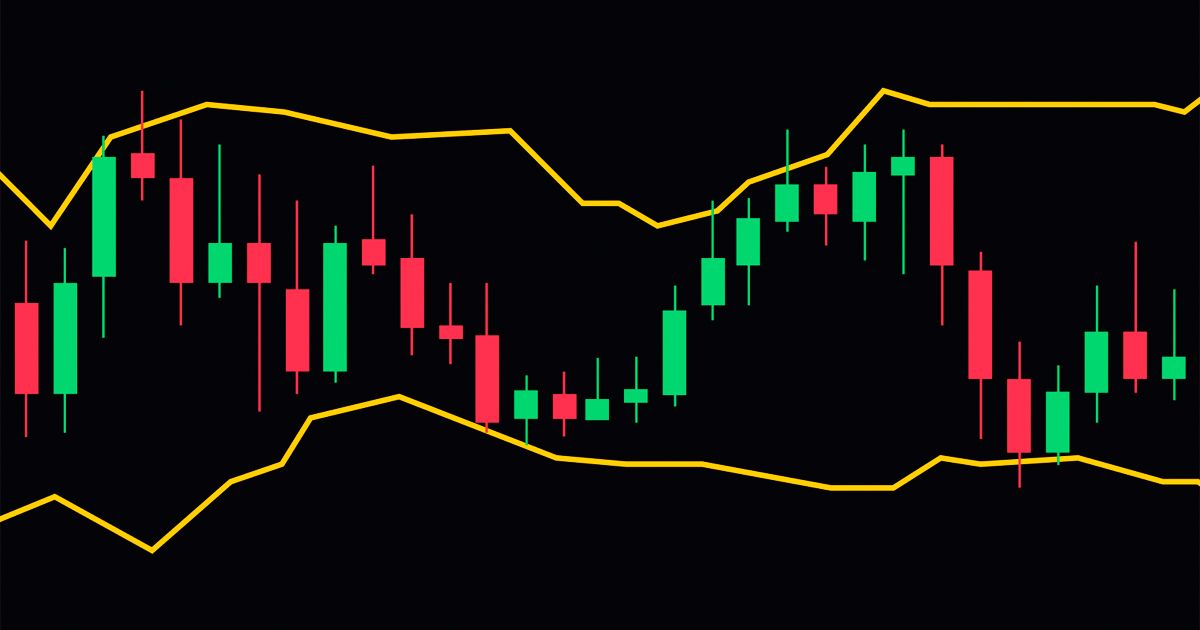
Bollinger Bands for Volatility Measurement
Bollinger Bands place two standard deviation bands around a 20 period SMA. Narrow bands mean low volatility. Wide bands mean high volatility.
Prices touching the upper band may signal overbought levels. Prices near the lower band may signal oversold levels. Traders watch for a "Bollinger squeeze" where bands tighten before a large price breakout.
This indicator helps you time entries around volatility shifts rather than guessing direction alone.
Volume Profile (VPVR) for Institutional Price Levels
Volume Profile shows the total volume traded at each price level over a selected period. Unlike traditional volume bars that track activity over time, VPVR reveals the prices where the most trades occurred.
High volume nodes act as strong support and resistance zones. Low volume nodes produce fast price moves because fewer traders hold positions there. Professional and institutional traders rely on this data to plan entries around key price levels.
The best tradingview indicator for understanding where large orders sit is Volume Profile.
Ichimoku Cloud for Full Market Context
The Ichimoku Cloud is a complete trading system inside a single indicator. It shows trend direction, momentum, and support and resistance levels all at once.