The Moving Average Convergence Divergence (MACD) is one of the most widely used technical indicators in trading. Developed by Gerald Appel in the late 1970s, this indicator enables traders to identify trend direction, momentum, and potential price reversals. To do this, it compares two moving averages of a security’s price. If you use it correctly, the MACD can be a powerful tool that helps to understand market dynamics and timing entries and exits.
The Moving Average Convergence Divergence is built from three components: the MACD line, the signal line, and the histogram. The MACD line is calculated by subtracting the 26-period Exponential Moving Average (EMA) from the 12-period EMA. The signal line is a 9-period EMA of the MACD line itself. The histogram shows the difference between the MACD line and the signal line, and visually represents the strength and direction of the market’s momentum.
The indicator is mainly used to spot crossovers, divergences, and momentum shifts. A bullish signal occurs when the MACD line crosses above the signal line, and a bearish signal appears when it crosses below the signal line. These crossovers often align with changes in trend direction or price breakouts.
The Moving Average Convergence Divergence (MACD) is suitable for all asset classes, such as stocks, forex, commodities, and cryptocurrencies. It is beneficial in trending markets where momentum plays the main role in price movement.
One of the main benefits of the MACD is its ability to provide both trend-following and momentum signals. This dual function makes it unique compared to other indicators that serve only one purpose. Traders who understand how to interpret MACD signals, understand how the market works, and act accordingly.
What Is Divergence?
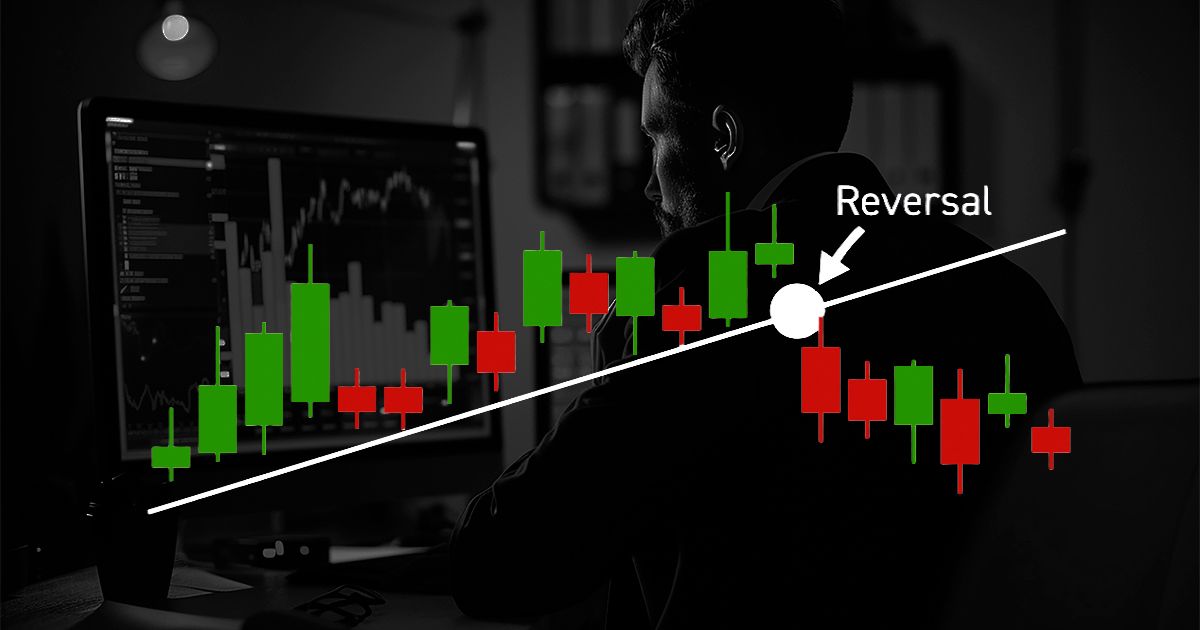
Divergence occurs when the price of an asset moves in the opposite direction of a technical indicator. In the context of the Moving Average Convergence Divergence indicator, divergence is a powerful signal that can suggest a potential reversal in the current trend. It can indicate that momentum is weakening and a shift in price direction may come.
There are two main types of divergence: bullish and bearish. Bullish divergence happens when the price creates a lower low while the MACD indicator forms a higher low. This suggests that although the price is falling, the downward momentum is getting weaker. This is a signal of a reversal to the upside. Bearish divergence occurs when the price forms a higher high but the MACD creates a lower high. This implies that upward momentum is fading, and a downward move is close.
The Moving Average Convergence Divergence (MACD) indicator can help identify tops and bottoms. However, it's important to note that divergence alone is not a guarantee of a reversal. Instead, it should be used in conjunction with other indicators or price action analysis for confirmation. For example, it is recommended to combine MACD divergence with support and resistance levels, or candlestick patterns, to enhance the reliability of the signal.
The MACD histogram is very useful to notice divergence, because it provides a clear visual of changes in momentum. When histogram bars begin to shrink while the price continues in its current trend, it could be an early sign of divergence.
While divergence is a standard signal used by both novice and experienced traders, it requires practice to identify correctly. A false divergence can lead to premature entries or false expectations about market direction. Therefore, it is important to understand the behavior of the Moving Average Convergence Divergence (MACD) indicator in various market conditions if you want to use divergence effectively.