VIX at a Glance: 5 Key Facts
| What is the VIX? | Real-time index measuring expected S&P 500 volatility over 30 days. |
| Who created it? | CBOE Global Markets, 1993. Updated with Goldman Sachs in 2003. |
| How is it calculated? | Weighted S&P 500 options prices, 23 to 37 days to expiry. |
| High VIX level | Above 30 signals fear. Above 40 is extreme panic. |
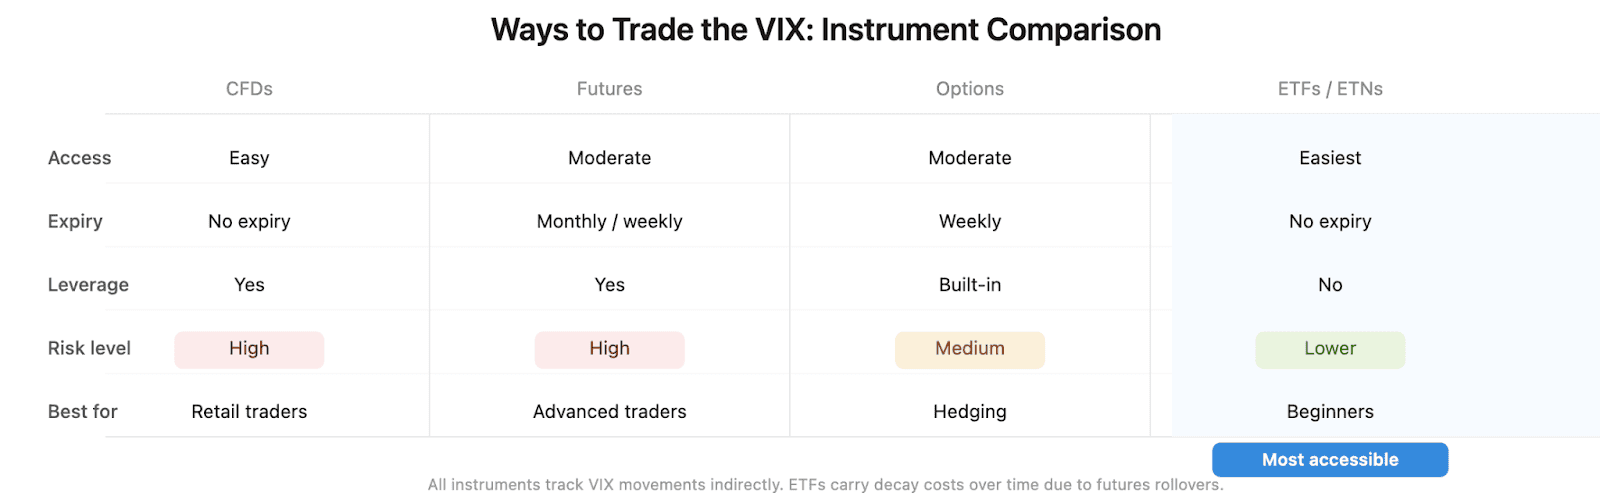
| Can I buy VIX? | No. Trade it via CFDs, futures, options, or ETFs. |
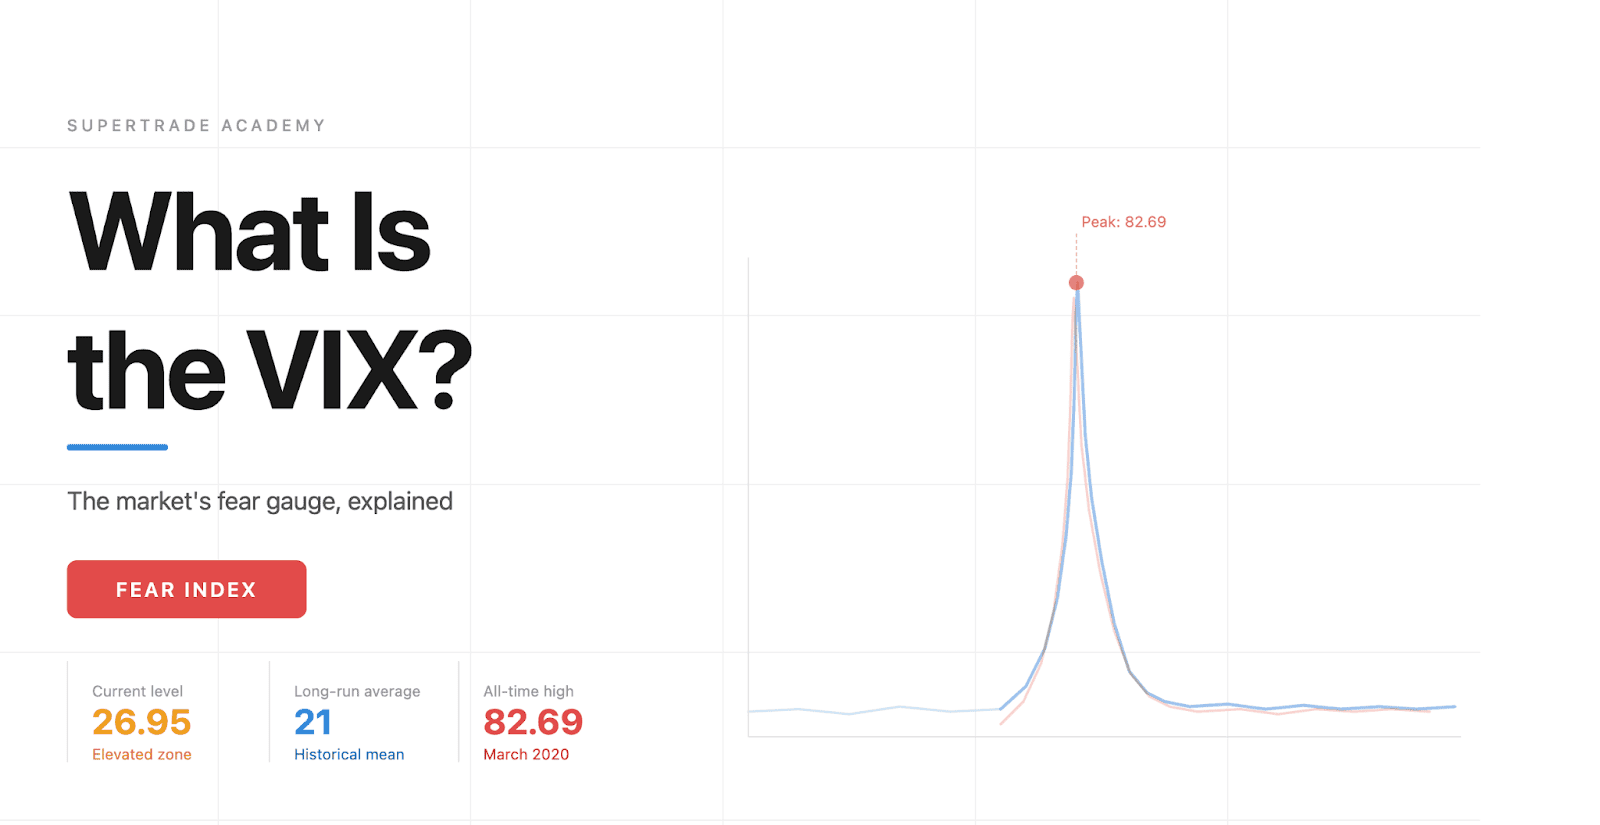
What Is the VIX Index?
Few market indicators get as much attention as the VIX. Every time markets turn turbulent, traders check it first. But most people who mention it have never taken the time to understand where it came from or what it actually tracks. Here is what you need to know.
VIX Meaning and Origin
The VIX stands for the CBOE Volatility Index. CBOE Global Markets introduced it in 1993. It was the first benchmark to quantify market expectations of near-term volatility. Back then, it tracked eight S&P 100 options.
Ten years later, in 2003, CBOE partnered with Goldman Sachs to rebuild the methodology. They expanded it to use the broader S&P 500. That change made the index far more representative of actual market conditions. In 2026, the VIX's index meaning goes beyond the acronym. It represents the market's collective expectation of risk over the next month.
“Today, traders worldwide treat the VIX as the standard measure of US equity market stress.”
What Does VIX Measure?
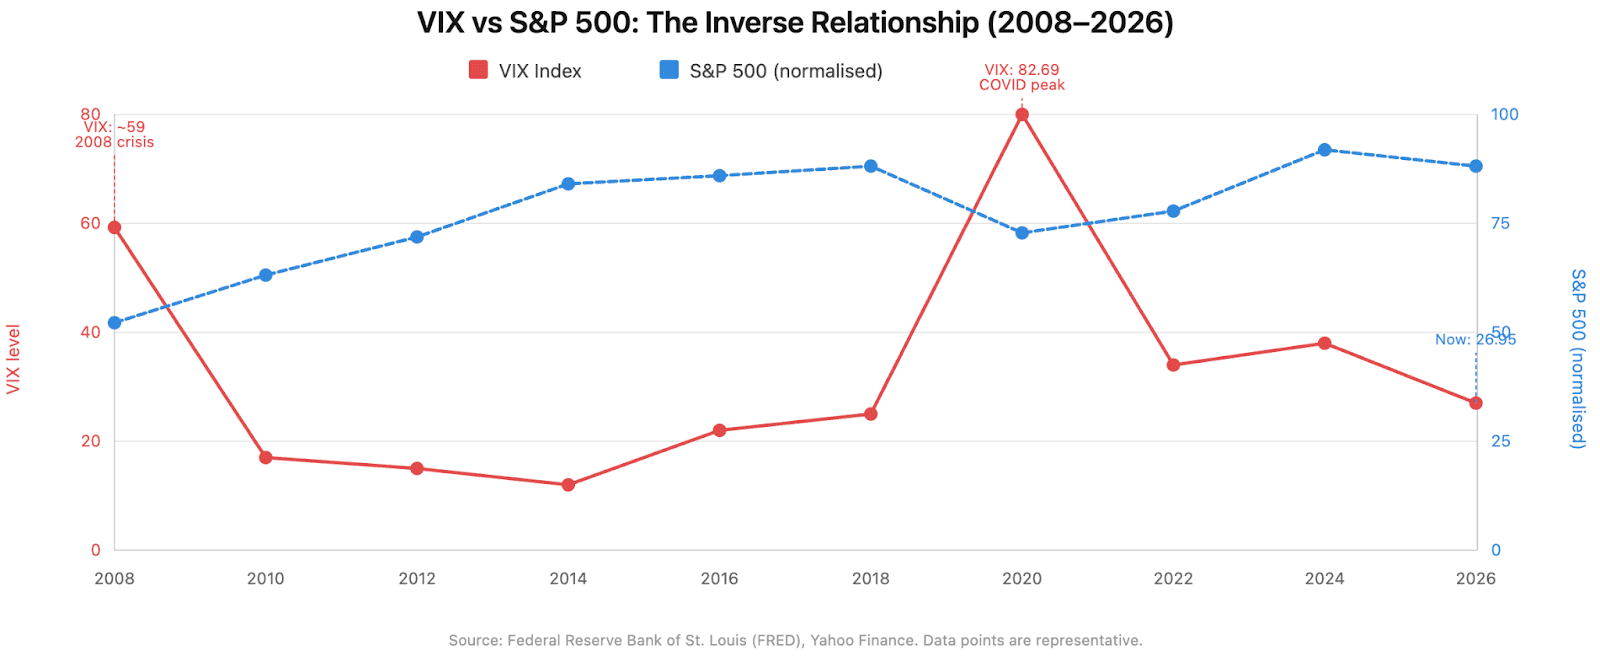
In practical terms, the VIX is straightforward to understand. What does VIX measure exactly? It shows how much the market expects the S&P 500 to move over the next 30 days. The result is expressed as an annualized percentage.
“It does not tell you which direction prices will go. It tells you how violently they might move.”
The VIX index's meaning is simple in practice. It is a number that tells you how much fear is priced into the market right now. It uses live S&P 500 put and call option prices to estimate implied volatility. Not past price history. When traders are nervous, they buy more options as a form of protection. That demand pushes option prices up. Higher option prices push the VIX higher.
Key takeaway: The marker measures expected S&P 500 volatility over 30 days using live options prices. Higher VIX means more fear. Lower VIX means more calm. It reflects where the market expects to go, not where it has already been.
How Does the VIX Work?
The VIX does not pull its value from stock prices or economic reports. It reads the options market. Specifically, it looks at how much traders are willing to pay for protection on the S&P 500. Understanding the mechanics behind this tells you why the index moves the way it does.
How VIX Values Are Calculated
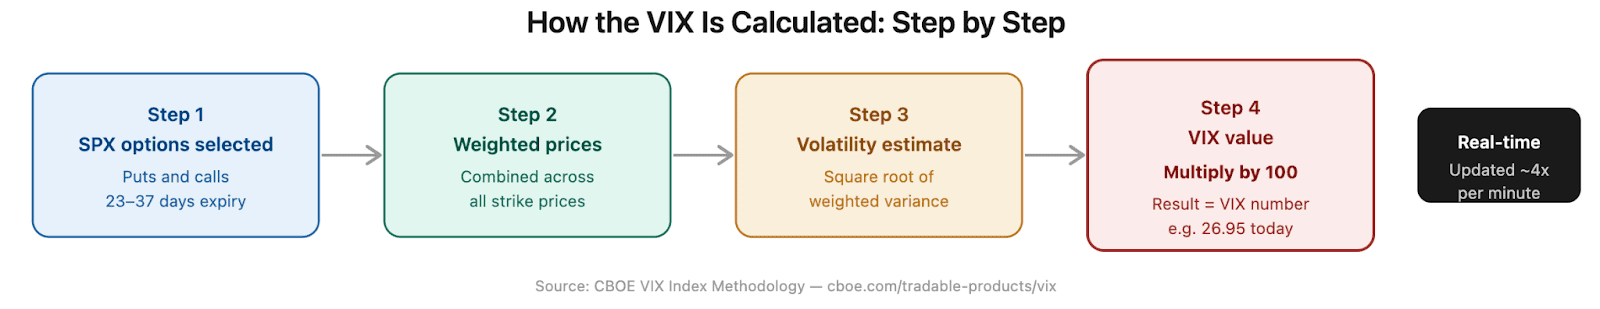
The CBOE calculates the VIX in real time. It uses two sets of S&P 500 options:
- Standard SPX options expiring on the third Friday of each month
- Weekly SPX options expiring every other Friday
- Only options with 23 to 37 days to expiration
- Both puts and calls across multiple strike prices
- All options must have valid bid and ask prices
The formula combines weighted prices across a wide range of strikes. The result estimates the expected fluctuation in the S&P 500. Multiply the final volatility figure by 100. That gives you the VIX value.
“You do not need to understand the full math to trade it. What matters is what the output means.”
How to Read the VIX Index
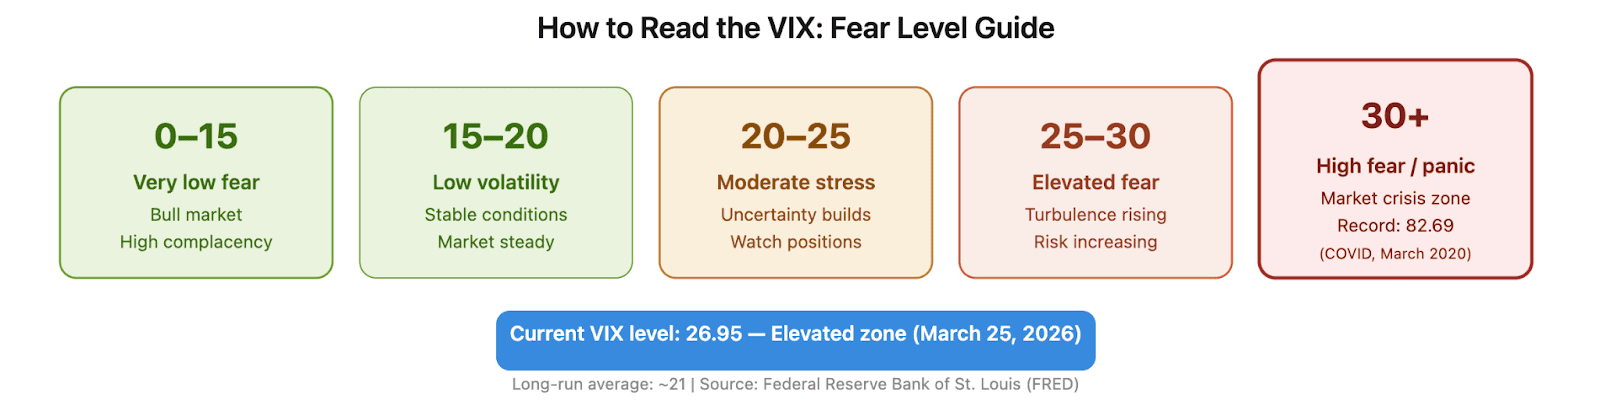
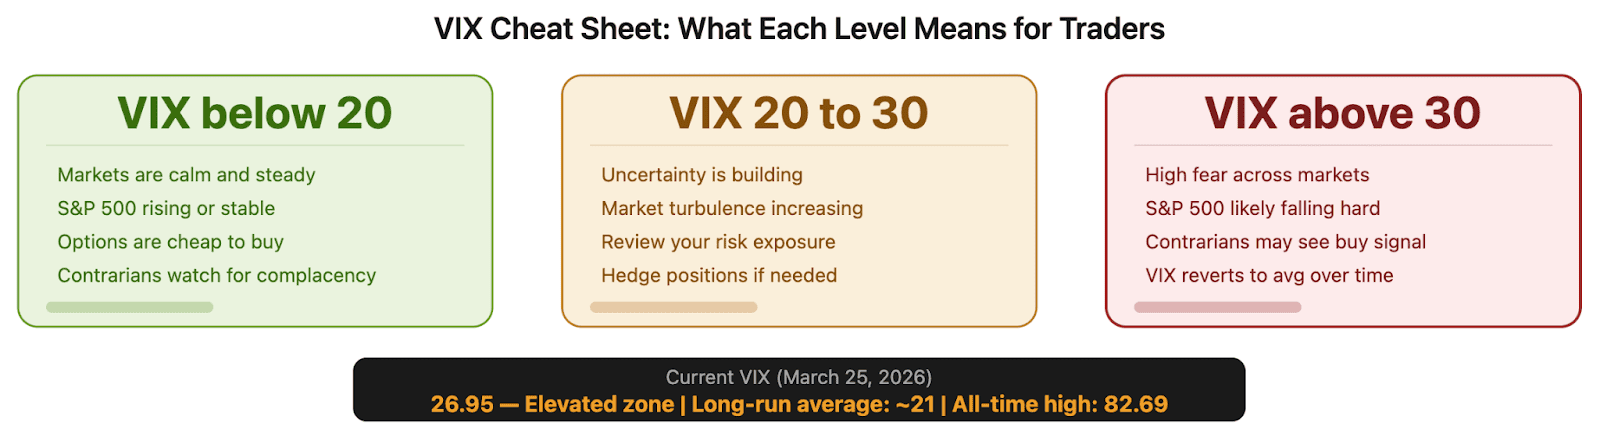
How to read the VIX index comes down to knowing the key thresholds. Here is how traders interpret each level:
| VIX Level | Market Signal | Typical Condition |
|---|---|---|
| Below 15 | Very low fear | Strong bull market, high complacency |
| 15 to 20 | Low volatility | Stable, steady market conditions |
| 20 to 25 | Moderate stress | Uncertainty is starting to build |
| 25 to 30 | Elevated fear | Market turbulence, risk rising |
| Above 30 | High fear | Significant uncertainty or crisis |
| Above 40 | Extreme panic | Major market event or crash |
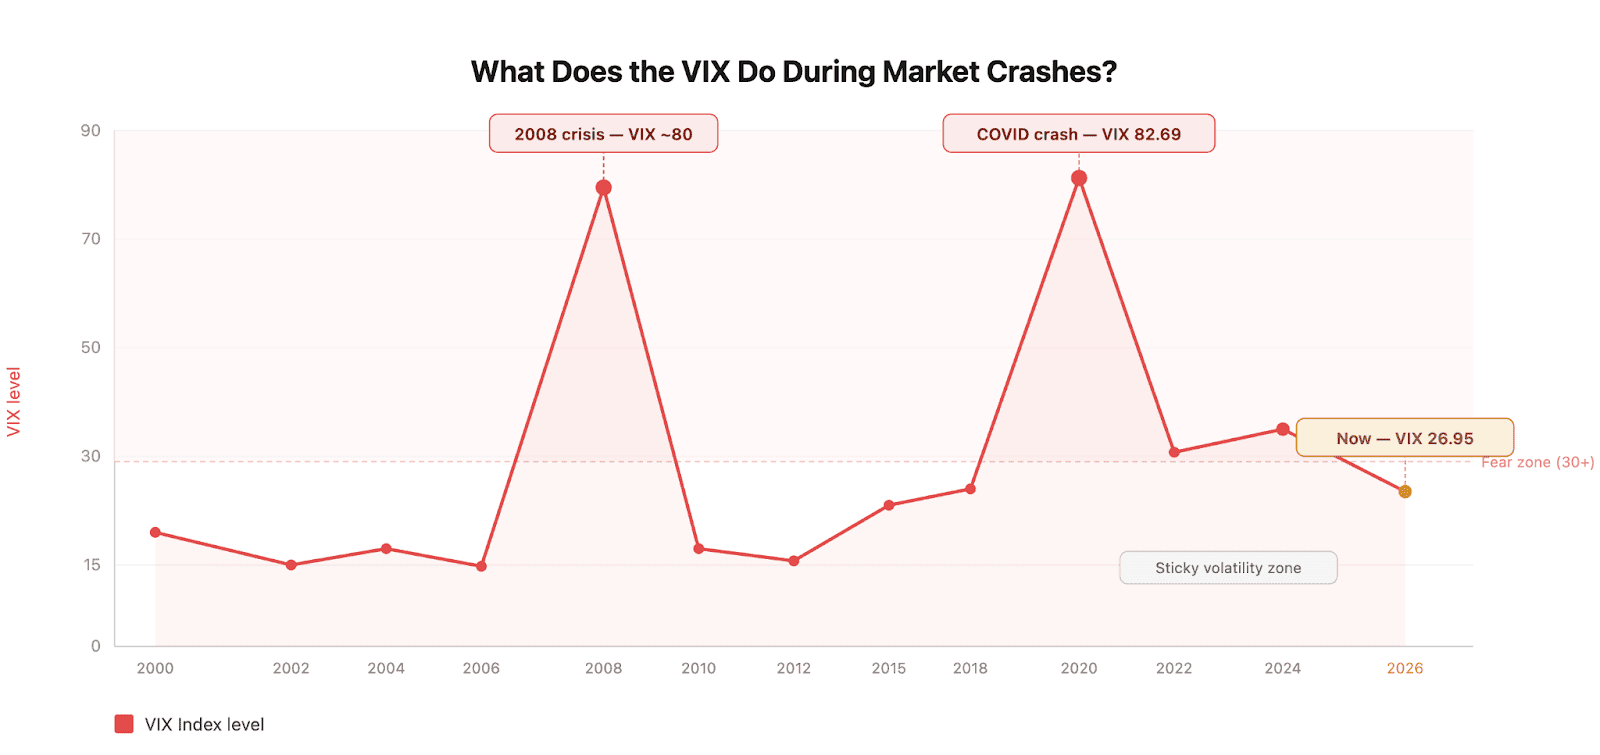
The long-run average sits around 21. The all-time high was 82.69 in March 2020 during the COVID crash. In August 2024, the unwinding of the Japanese yen carry trade sent the VIX to an intraday high of 65 in a single session.
What Is Considered a High VIX?
What is considered a high VIX has a clear answer. A reading above 30 signals that traders expect sharp price swings. They are paying up for protection. Readings above 40 indicate serious market dislocations.
The current level of 26.95 sits in the elevated zone. As MarketMinute reported on March 24, 2026, this is the highest sustained VIX level in nearly two years. Geopolitical tensions and persistent inflation are the primary drivers.
Key takeaway: VIX below 20 signals stability. Above 30 signals real fear. The calculation uses live S&P 500 options prices across dozens of strike prices, updated in real time throughout the trading day.