Bollinger Bands are one of the most widely used tools in technical analysis. This tool offers traders valuable information about price trends and market volatility. Bollinger Bands visualize price movement around a central moving average and outer bands. With it, this tool helps traders to identify points to exit and enter trades, see what conditions are in the market, and make better decisions.
If you want to use Bollinger Bands effectively, you need to understand how they work. Let’s check it.
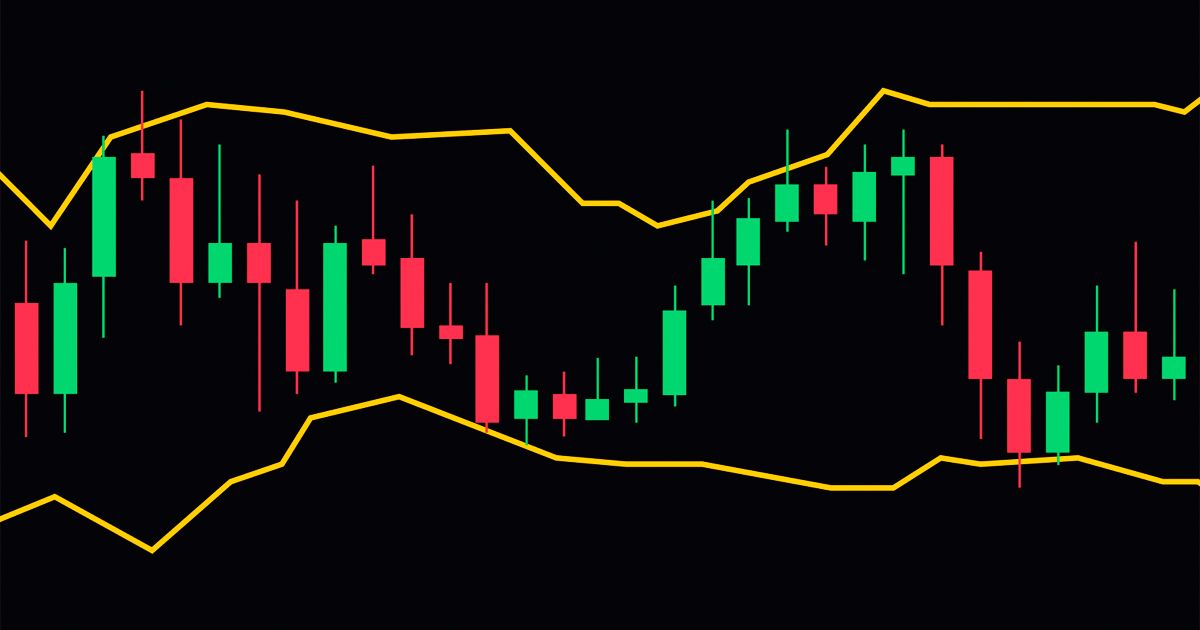
Each Bollinger Band consists of three components:
- A middle band, which is typically a simple moving average (SMA)
- Two outer bands that represent standard deviations above and below the SMA.
The distance between the bands changes depending on the market volatility. When the volatility is high, the bands widen. And when the volatility is low, the band narrows. This is how traders can see whether there are quick price changes and place trades accordingly.
When the price approaches the upper band, it means that the asset is overbought. And when the price moves to the lower band, it shows that the asset may be oversold.
Bollinger Bands do not provide exact buy or sell signals. This is why you shall use them in combination with other indicators and add price action analysis. For example, if the price goes above the upper band and there is a strong uptrend, then, the trend may continue.
Bollinger Bands can also help you to see when there is market compression. When the bands contract, the volatility is low, and there may be a breakout. You can see when price movements are coming, and you can get ready for this.
Bollinger Bands also can help you to identify trends. If the price tries to cross the upper band, there is an uptrend. And during the downtrend, the price moves to the lower band. If you know how to observe the price movements, you can see where the market is moving and adjust your strategy. You can also combine this indicator with momentum indicators and volume indicators to confirm your guesses.
Bollinger Bands are a very good tool. They help to see the market trends and volatility level. This is how you can make more accurate trading decisions.
Trend and Volatility
One of the main advantages of Bollinger Bands is that they not only show the trend but also show the volatility. Many indciators focus on price only or on market volatility, and this is why Bollinger Bands is very important, because it visualizes both.
The middle SMA band represents the general trend. It can help you determine whether an asset is in an uptrend, downtrend, or sideways market. The outer bands expand and contract based on standard deviation. It gives you a clear image about the market volatility. This all can help you to adapt your strategy to changing market conditions.
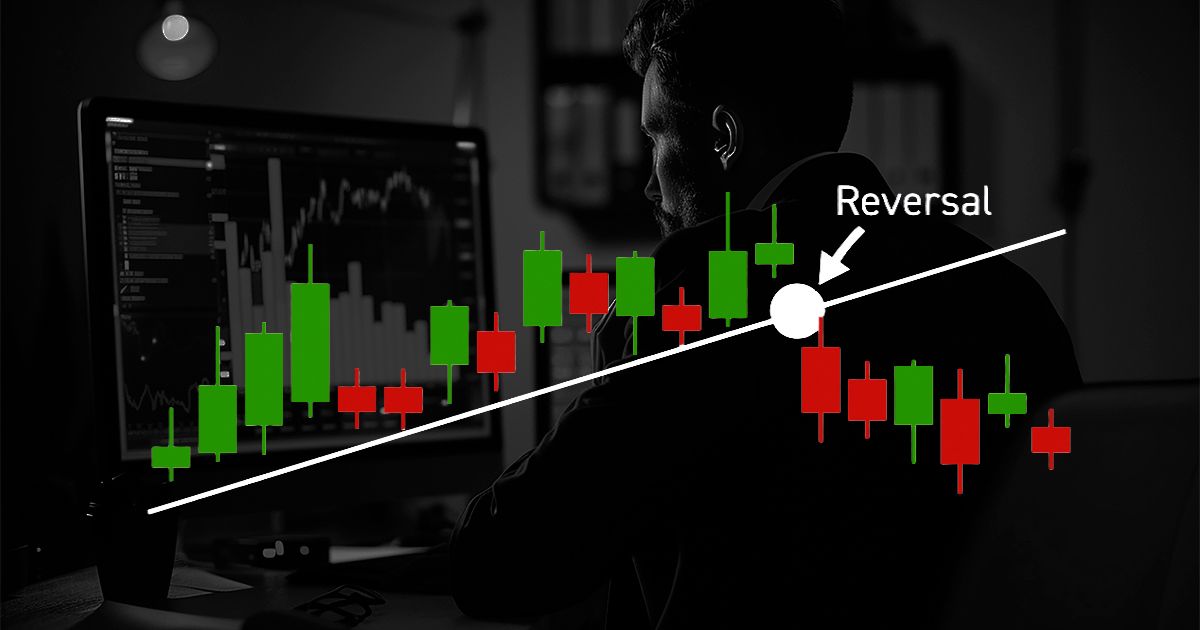
You can follow the bands to assess the market momentum. For example, if the price comes close to the upper band during an uptrend, it indicates strong buying pressure, and it means that the trend may continue. And on the contrary, if the price comes close to a lower trend during a downtrend, it shows that there is a selling pressure. Sudden moves away from the bands may suggest trend exhaustion or upcoming reversals and providence very important signals to help you create the right strategy.
If you know how analyze volatility and Bollinger Bands to manage risks properly. Ifnthe bands are wider, the price may change even more. And this means that you will need to adjust your positions in size and place stop-losses. If the bands a narrow, and the volatility is low, it shows that there may be a breakout. This combination allows traders to adjust strategies to both trending and range-bound markets.
Bollinger Band technical analysis also helps to identify overextended market conditions. When the price moves sharply away from the middle band and touches or pierces the outer band, it can signal that the asset is temporarily overbought or oversold. You can also check whether the confirmations are, such as trendline breaks, candlestick reversals, and adjust your positions accordingly.
You can combine trend and volatility indicators, Bollinger Bands, and adjust your approach according to the current market.