Technical Analysis

Sep 3, 2025 - 5 min

●●Intermediate

Updated: May 20, 2026

How to Identify a Trend Reversal in Stocks and Forex

How to Identify a Trend Reversal in Stocks and Forex

A market reversal does not announce itself. Price shifts direction, and most traders only notice after the move is already underway. This guide breaks down what a trend reversal is, how to identify one in real time using price structure and indicators, and how to separate a genuine shift from a temporary pullback that traps traders on the wrong side.

Justin Freeman
Reviewed by:
Share

Trend Reversal at a Glance: Key Facts

QuestionAnswer
What is a reversal in stocks?A sustained change in price direction, from uptrend to downtrend or the reverse
How is a reversal different from a pullback?A pullback is temporary and stays within the prior trend; a reversal changes the dominant direction
What is the best indicator for trend reversal?No single indicator is best; RSI divergence, MACD crossovers, and moving average crossovers each provide different signals
How do you confirm a trend reversal?Use at least two signals together: price structure break, volume change, and indicator confirmation
Can reversals be predicted?They can be analyzed and anticipated, but timing remains uncertain and confirmation always matters
What timeframes work best?1-hour and 4-hour charts balance signal quality and noise for most traders

What Is a Reversal in Stocks and Forex?

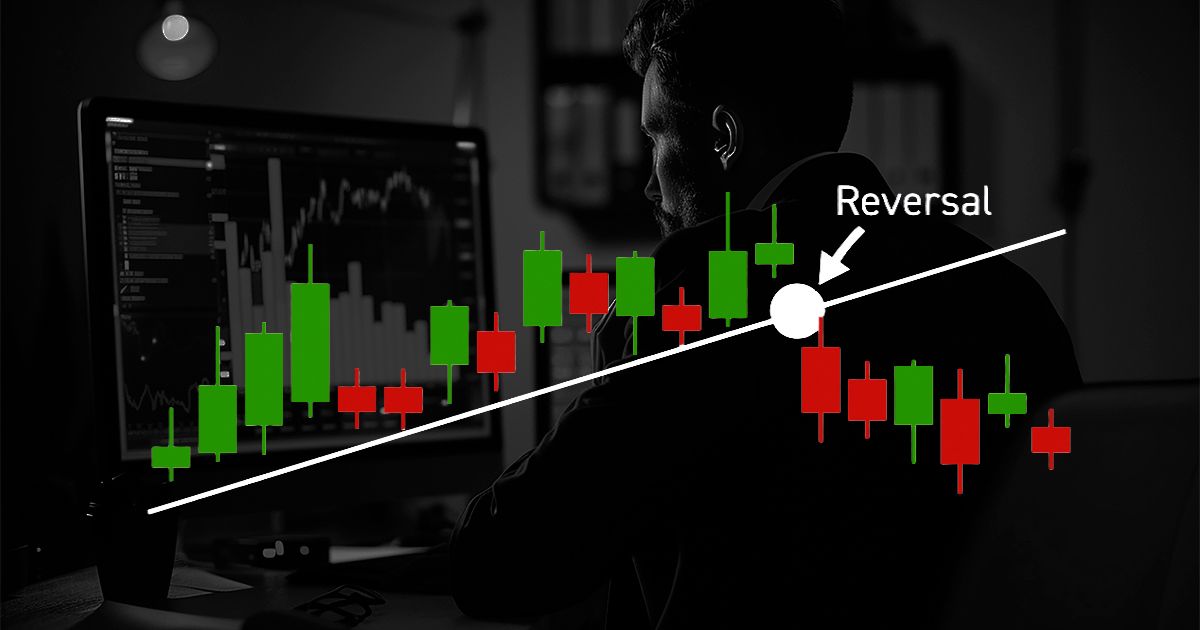
A trend reversal is a sustained change in the dominant direction of price. When a market that was making higher highs and higher lows starts to form lower highs and lower lows, that is a bearish reversal. The opposite structure marks a bullish one. The key word is sustained: one red candle after a long uptrend is not a reversal.

Every trend eventually ends. Dow Theory states that a trend continues until there is clear evidence it has reversed. That principle still holds today. What changes is the weight of evidence required before a trader acts on it.

Reversal vs. Pullback: The Difference That Matters

A pullback is a short-term move against the prevailing trend. It does not break the trend structure. In an uptrend, price pulls back to a prior support zone and then resumes moving higher. A reversal goes further: it breaks the prior swing low, changes the sequence of price action, and begins building a new structure in the opposite direction.

The practical test is simple. Ask whether the trend is still making the same pattern of highs and lows. If the structure is intact, you are likely watching a pullback. If the structure has broken, the case for a reversal is building.

Bullish vs. Bearish Reversals

A bullish reversal occurs when a downtrend ends and price begins moving higher. A bearish reversal occurs when an uptrend ends and price begins moving lower. Both types follow the same logic: the prior trend loses momentum, price breaks structure, and a new direction takes hold.

Bullish reversals are often associated with oversold readings and buying volume increases. Bearish reversals tend to follow extended uptrends, overbought conditions, and weakening buying pressure. Both require confirmation before a trader commits capital.

Key Takeaway: A market reversal is a structural change, not a single candle or a short-term dip. It is confirmed when price breaks the prior trend structure and holds. Acting before that confirmation produces false signals far more often than real ones.

How to Identify a Trend Reversal: 4 Signals to Watch

Identifying how to identify a trend reversal starts with price behavior, not indicators. Indicators are derived from price, which means price always leads. Four signals give traders a practical framework for reading a potential change in direction.

Price Structure Breaks

In an uptrend, price makes a sequence of higher highs and higher lows. A structural break happens when price takes out the most recent swing low. That single event does not confirm a reversal on its own, but it is the first requirement. Without a structural break, every other signal is premature.

Watch for two things after a structural break:

  • Price fails to reach the prior high on the next rally
  • Price then takes out the low that created the break

Both conditions together signal that the prior uptrend has likely ended. The same logic applies in reverse for downtrends turning bullish.

Structural breaks work on every asset class and every timeframe. Higher timeframes (daily, weekly) produce more reliable signals with fewer false starts than lower timeframes.

Volume Confirms the Shift

Volume is the weight behind price movement. A breakout or structural break on thin volume is less reliable than the same move on expanding volume. When price breaks a key level and volume increases significantly above its recent average, that combination carries more weight.

Declining volume during a trend continuation is a warning sign. It means fewer participants are supporting the move. When volume then picks up on counter-trend moves, that tells you who is gaining control of the market.

Support and Resistance Breakouts

Support and resistance levels mark the prices where buying and selling have historically concentrated. When price breaks below a significant support level and closes beneath it on multiple candles, that level often becomes new resistance. This flip is a classic sign of a trend reversal in progress.

The key is confirmation through multiple closes. One candle poking below a level and recovering is not a breakout. The market needs to accept the new price. Traders experienced in reading price structure look for at least two to three candles closing below the prior support before treating the level as broken.

Become a Confident Trader

Master trading with our structured course designed for beginners and intermediate traders.

Step-by-step lessons
Real strategies
Risk management training

Join 10,000+ traders improving their skills

Start Course Now

Candlestick Patterns That Warn You Early

Certain candlestick formations appear frequently before confirmed market reversals. They do not guarantee a direction change, but they signal that momentum is shifting.

The most reliable patterns are:

  • Bearish engulfing: A large red candle fully engulfs the prior green candle at a resistance zone
  • Bullish engulfing: A large green candle fully engulfs the prior red candle at a support zone
  • Pin bars: Long wicks rejecting a key price level show strong buying or selling

These patterns gain reliability when they form at significant structure levels, not in the middle of a range. A bearish engulfing candle in the middle of a consolidation means very little. The same pattern at a multi-month resistance zone carries real weight.

Key Takeaway: Price structure breaks are the foundation of trend reversal analysis. Volume and candlestick patterns add weight to the signal. All three together produce a far stronger read than any one signal in isolation.

Best Indicators for Trend Reversal

No indicator is the single best tool for identifying market reversals. Each measures a different aspect of price behavior, and they become more useful when combined. The table below shows how the three most widely used indicators compare.

IndicatorWhat It MeasuresBest Used ForMain Weakness
RSI (14-period)Momentum speed and overbought/oversold conditionsSpotting divergence before a reversalCan stay extreme for long periods in strong trends
MACD (12/26/9)Relationship between two moving averagesConfirming trend direction changeLags price; slower signal than RSI
Moving Averages (50/200)Average price over timeGolden cross and death cross signalsSignificant lag; best on higher timeframes

RSI Divergence

RSI divergence is one of the most reliable early signals of a trend reversal. It occurs when price and the RSI indicator move in opposite directions. When price makes a new high but RSI makes a lower high, that is bearish divergence. It tells you that momentum is weakening even as price appears to extend.

The reverse is bullish divergence: price makes a new low but RSI makes a higher low. Research on the RSI indicator shows accuracy rates approaching 97% when applied during periods of heightened price volatility, though traders should note that no single study applies universally across all market conditions.

The standard RSI reading to watch: above 70 indicates overbought conditions and a possible bearish reversal; below 30 indicates oversold conditions and a possible bullish reversal. In sustained trends, RSI can stay above 70 for extended periods, which is why divergence matters more than the absolute reading.

MACD Crossover

The MACD indicator measures the relationship between a 12-period and a 26-period exponential moving average. When the MACD line crosses above its signal line, that is a bullish signal. When it crosses below, that is a bearish signal. 

MACD divergence follows the same logic as RSI divergence. When price makes higher highs but MACD makes lower highs, momentum is weakening. A backtested MACD and RSI combined strategy showed a 73% win rate across 235 trades, with an average gain of 0.88% per trade including commissions and slippage. That result came from a specific setup with a third mean-reversion filter, not from using MACD alone.

MACD is slower than RSI. It works better for confirming a reversal that RSI has already flagged, rather than as a first signal.

Moving Average Crossovers

The golden cross and the death cross are the two most watched moving average signals in technical analysis. A golden cross occurs when the 50-day moving average crosses above the 200-day moving average. A death cross occurs when the 50-day crosses below the 200-day.

These signals are significant on daily and weekly charts. On lower timeframes, they produce too many false signals to be useful on their own. The death cross that appeared across several major indices before the 2022 drawdowns provided early warning to traders who combined it with structural analysis.

Moving average crossovers lag price. By the time a death cross forms, a meaningful portion of the downtrend has already occurred. Use them to confirm direction, not to time precise entries.

Key Takeaway: RSI divergence gives the earliest warning, MACD confirms momentum change, and moving average crossovers confirm the broader direction shift. Combining all three reduces false signals and improves the quality of reversal reads.

Trend Reversal Strategy: Acting Early vs. Acting Late

Most articles tell you what signals to watch. They skip the practical cost of getting the timing wrong. This is the angle that separates traders who use reversal analysis well from those who do not.

The Cost of Acting Too Early

Traders who act on the first reversal signal without confirmation often enter trades that fail. The market tests a support level, RSI reaches 30, and a trader buys expecting a bullish reversal. Price then breaks through that support and drops another 15%. Acting on a single signal, without structural confirmation, produces this result frequently.

A false reversal is not just a bad trade. It erodes confidence in the strategy itself, leading traders to abandon a sound framework after a string of early entries. The fix is simple: require at least two confirming signals before committing. One indicator signal alone is a reason to watch. Two signals aligned is a reason to plan an entry. Three signals aligned is a reason to act.

The Cost of Acting Too Late

Waiting for perfect confirmation solves the false signal problem but creates a different one. By the time a structural break is confirmed, RSI divergence is clear, and volume has expanded, a significant portion of the reversal move has already happened. The risk-reward ratio has narrowed. Entry becomes less favorable.

The practical solution is a tiered approach:

  • Stage 1 (watch): First signal appears (divergence or structural warning)
  • Stage 2 (prepare): Second signal confirms (breakout with volume, MACD crossover)
  • Stage 3 (act): Third signal aligns (structure fully broken, indicators confirm)

At Stage 2, a trader can size into a partial position. At Stage 3, the full position is justified. This approach accepts a slightly worse entry in exchange for a much higher probability trade.

Multi-Timeframe Approach

Reversal signals on lower timeframes are far less reliable than the same signals on higher timeframes. A structural break on a 5-minute chart means almost nothing. The same break on a daily chart carries real weight.

The most effective approach: use the daily chart to identify that a reversal is developing, then use the 4-hour or 1-hour chart to time entry. This filters out most noise while still allowing relatively precise positioning.

Key Takeaway: The best trend reversal strategy is not about being first. It is about being right at a point where the risk-reward still makes sense. Tiered entry, multi-timeframe confirmation, and requiring two or three signals before acting dramatically improve results over single-signal trading.

Key Takeaways: What You Need to Know About Market Reversals

A trend reversal is confirmed by a change in price structure, not by a single candle or indicator reading. RSI divergence provides the earliest warning, while MACD and moving average crossovers confirm the broader direction change. Acting on one signal without confirmation leads to false entries far more often than real reversals. Combining structural analysis with at least two indicator signals, across multiple timeframes, gives traders the clearest read on whether a market reversal is real.

Frequently Asked Questions

Disclaimer: This article is for informational purposes only and does not constitute financial advice. Trading involves risk and may result in loss of capital.

The First Move Is Yours

Discover how Supertrade can transform your trading career. Explore challenges, access instant funding, and join a growing community of Supertraders.

Stay Ahead of the Game

Sign up to receive exclusive tips, market insights, and the latest updates from Supertrade. Don’t miss out on opportunities to grow your trading success.
Discord

Our Community

Do not skip any beat.

The Ultimate Trading Community. Join our Discord server to get the latest updates, news and more.

2026 Supertrade. All rights reserved
DiscordInstagramTelegramYouTubeX
Trading involves significant risk. Past performance is not indicative of future results. This is a simulated trading environment. Supertrade provides educational trading services.
Supertrade
Supertrade Ltd, a company incorporated under the laws of Saint Lucia with registered number 2024-00699, located at Ground Floor, Rodney Court Building, Rodney Bay, Gros Islet, Saint Lucia, LC01 101, operates and owns this website, as well as provides services under the Terms and Conditions posted on the website. Supertrade Prop Ltd, a company incorporated under the laws of England and Wales with registered number 16234284, located at 52-56 Standard Road, London, England, NW10 6EU, acting as a payment agent.