
Technical Analysis at a Glance
| Question | Answer |
|---|---|
| What is technical analysis? | A method of reading price and volume data on charts to identify trade entry and exit points. |
| When did it originate? | Charles Dow published its foundations across 255 Wall Street Journal editorials between 1900 and 1902. |
| What markets does TA apply to? | Stocks, forex, commodities, indices, crypto, and CFDs. |
| What are the main tools? | Moving averages, RSI, MACD, Bollinger Bands, trend lines, support, and resistance levels. |
| How does TA differ from fundamental analysis? | Fundamentals assess company value. Technicals assess price behavior and market trends. |
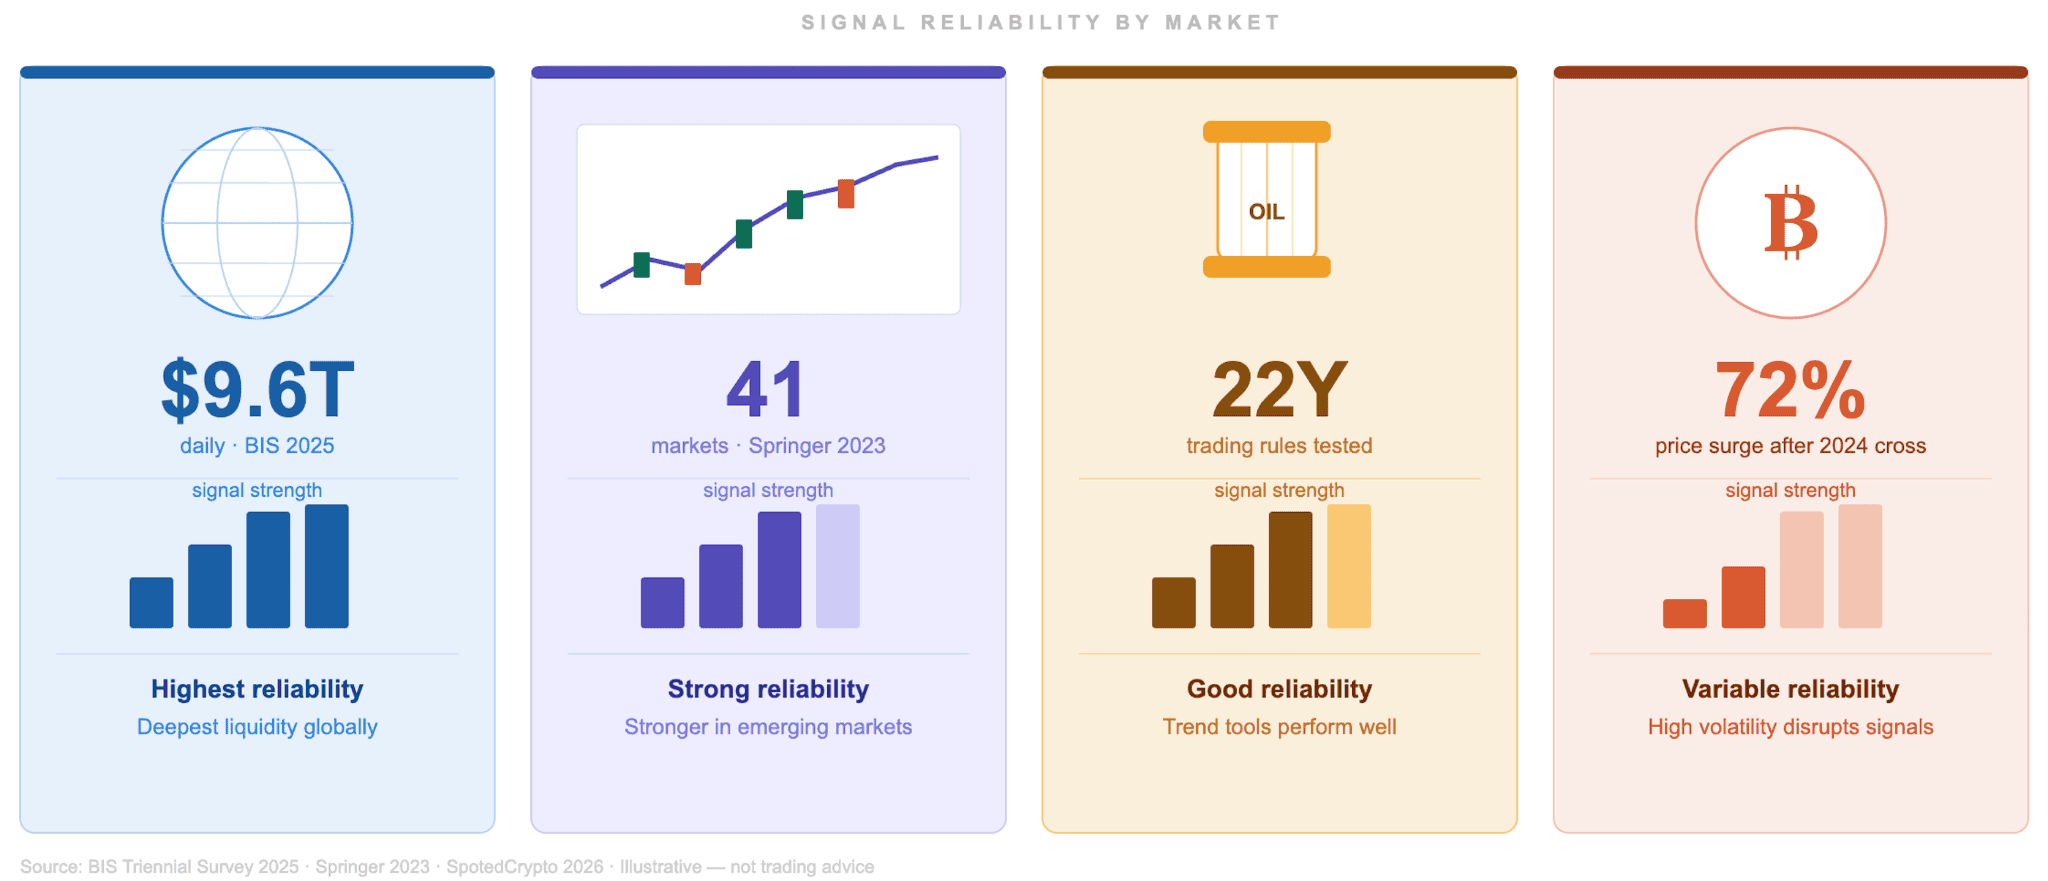
| Do professionals use TA? | Yes. Over 90% of London-based forex traders assigned significant weight to technical analysis in a Bank of England survey. |
Core Principles of Technical Analysis
Charles Dow wrote 255 editorials in The Wall Street Journal between 1900 and 1902. Those editorials became the foundation of technical analysis as a formal discipline. Robert Rhea codified them into Dow Theory in 1932, and the framework has not changed at its core since.
The three principles Dow identified still underpin every chart-based decision traders make today. They are observed patterns in market behavior across cycles, asset classes, and timeframes.
Three Assumptions Traders Build On
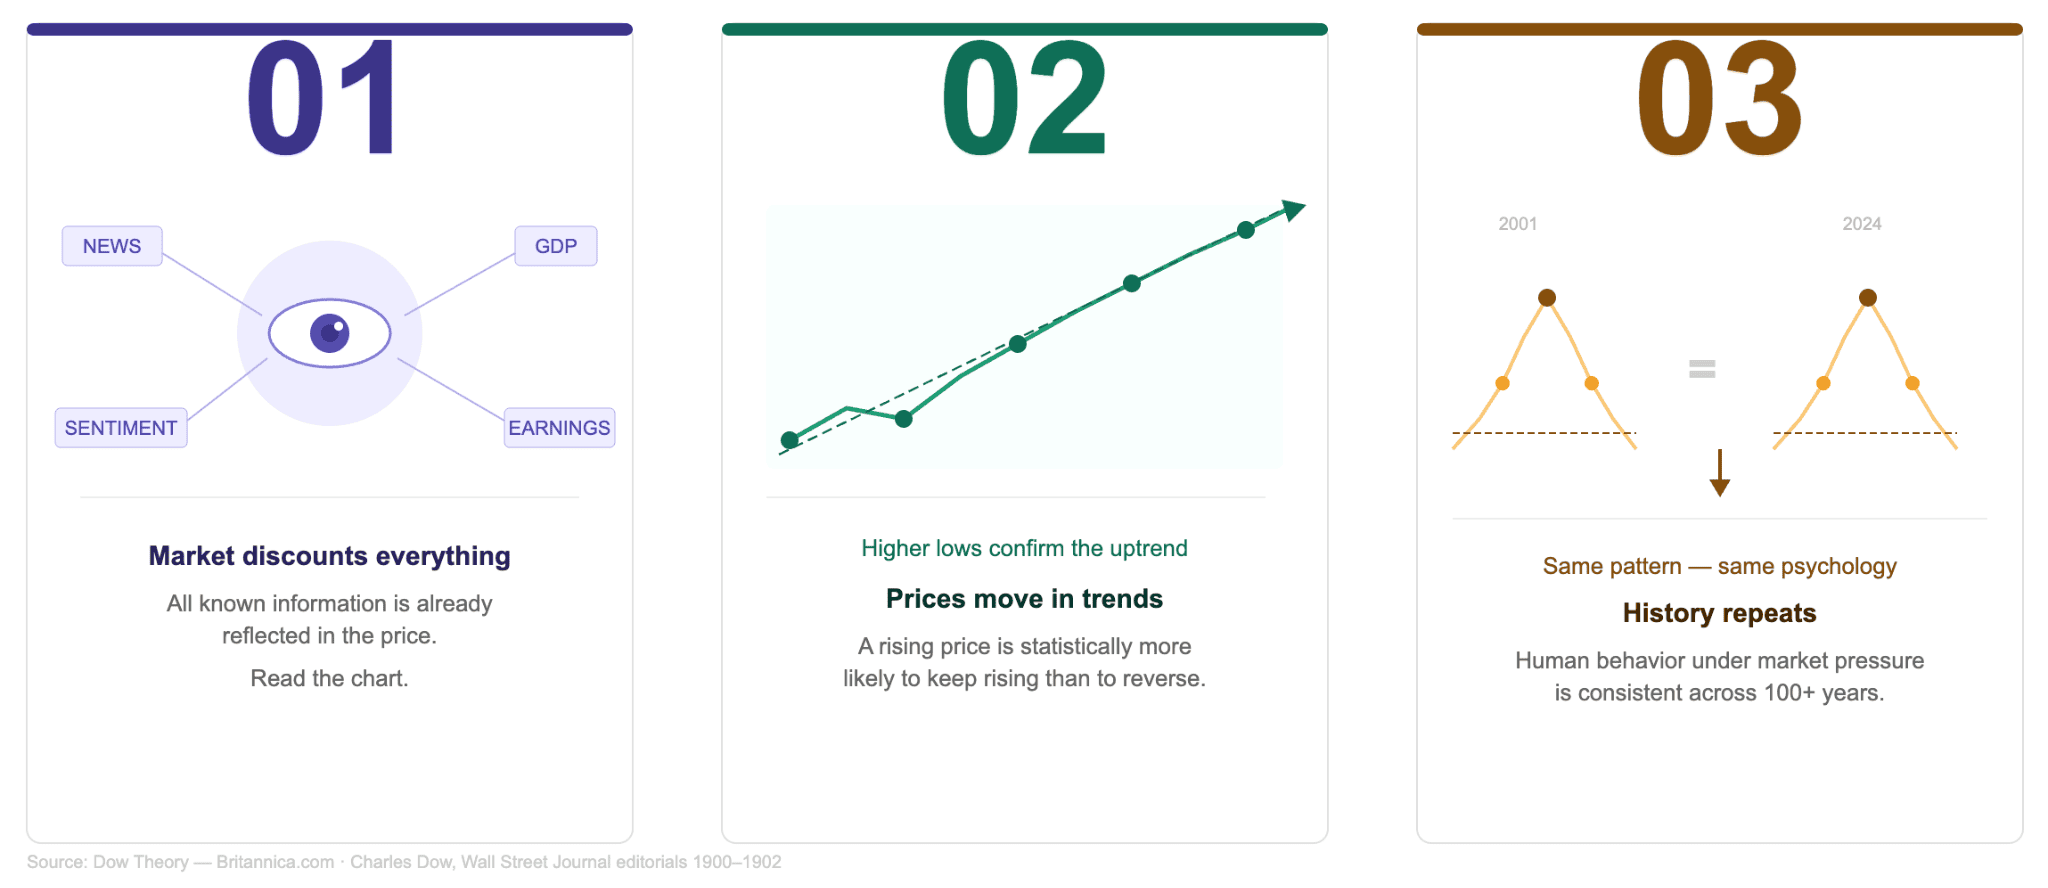
The first assumption is that the market discounts everything. Price at any given moment reflects all available information, from earnings reports to geopolitical events. You do not need to read the news separately. The chart already shows you what the collective market has concluded about it.
The second assumption is that prices move in trends. A rising price is statistically more likely to continue rising than to reverse without cause. Trend-following strategies are built entirely on this observed behavior.
The third assumption is that history repeats. Market participants respond to similar conditions in similar ways. Research covering 6,406 technical trading rules across 41 markets over up to 66 years found that technical rules outperformed a simple buy-and-hold strategy in the majority of those markets.
Technical vs Fundamental Analysis
What is technical analysis in investing compared to fundamental analysis? The two disciplines answer different questions. Fundamental analysis asks whether an asset is worth owning based on financial data. Technical analysis asks whether the current price action supports entering or exiting a position now.
A fundamental analyst studies revenue, earnings, and balance sheets. A technical analyst studies price charts, volume data, and price patterns. Neither approach makes the other irrelevant. Many institutional traders use fundamentals to decide what to trade and technicals to decide when to act.
Key takeaway: Technical analysis rests on three principles first published by Charles Dow in The Wall Street Journal over 120 years ago. Price reflects all known information. Trends persist until broken. Patterns repeat because human behavior under market pressure is consistent. A study of 6,406 trading rules across 41 markets confirmed these patterns hold across both developed and emerging markets.
Charts, Trends, and Price Patterns
Every technical analysis basics education starts with the chart. A chart is not decoration. It is a compressed record of every buy and sell decision made in a market over a given period. Reading one correctly gives you more actionable information than most market commentary does.
66% of traders use daily charts as their primary timeframe for market observation. The timeframe you choose changes the signals you see. Getting the chart type and timeframe right before analyzing anything else is a necessary first step.
Chart Types and What They Show
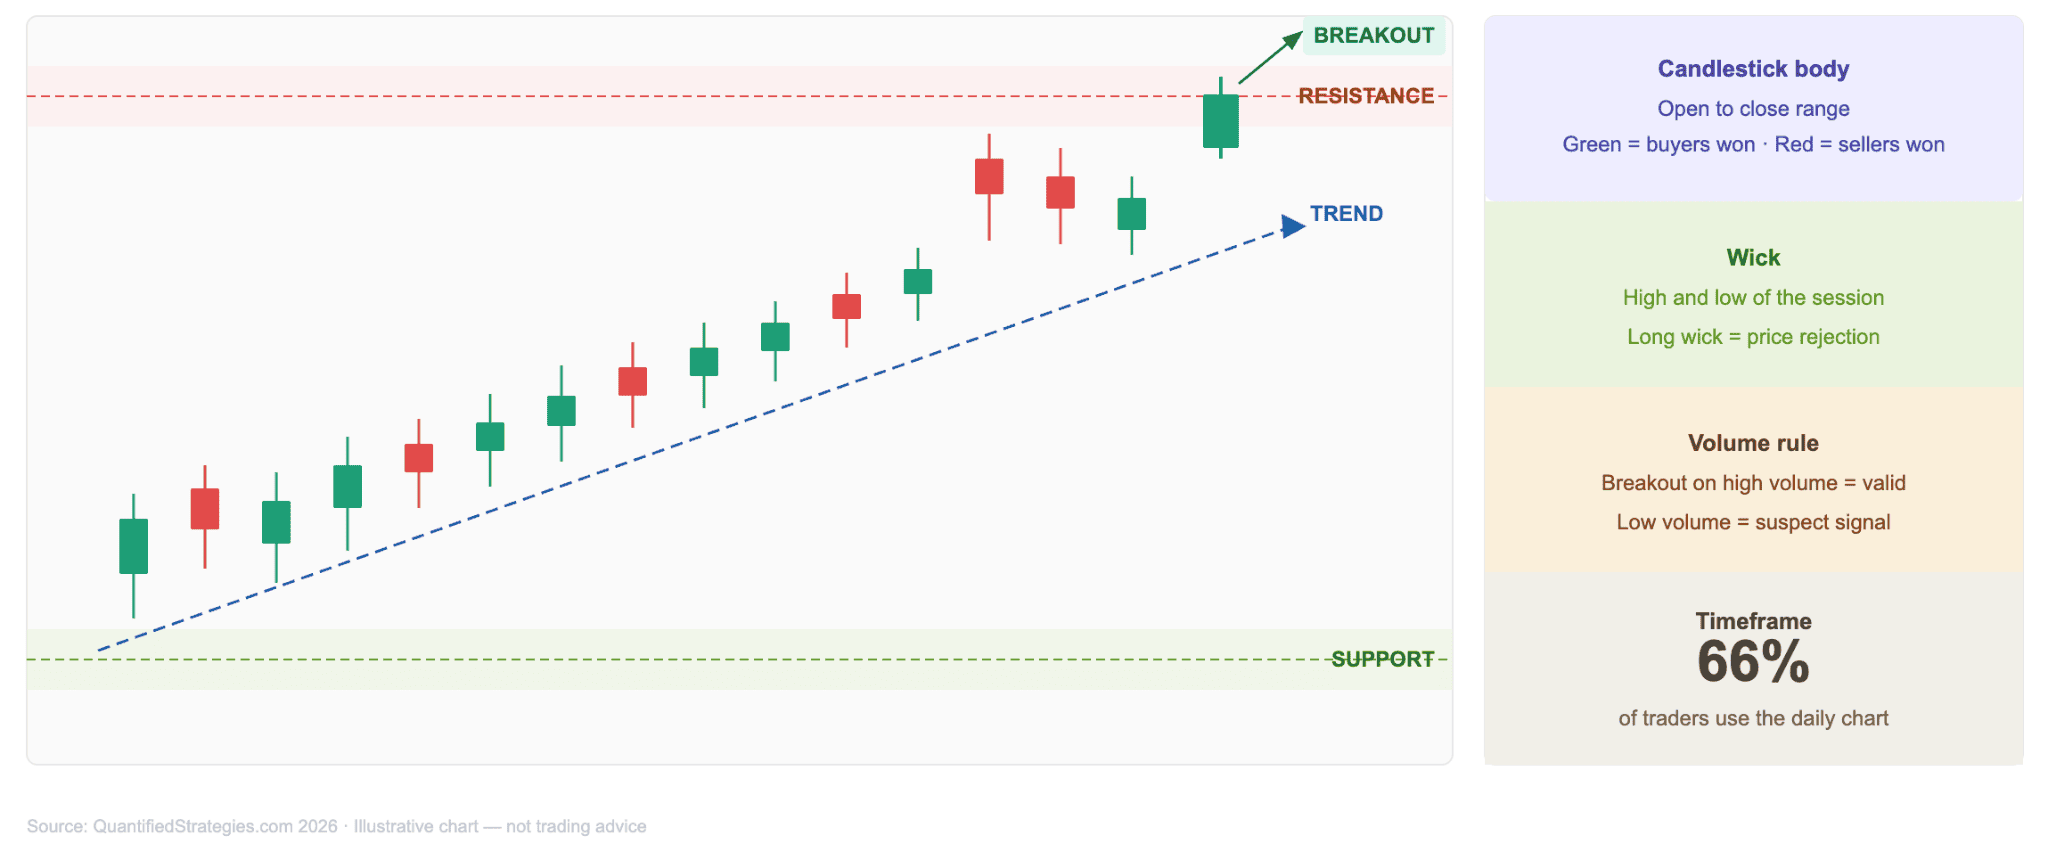
A line chart connects closing prices over time. It shows direction clearly but strips out intraday detail. A bar chart adds the open, high, low, and close for each period. A candlestick chart presents the same four data points in a visual format that makes the battle between buyers and sellers immediately readable.
Candlestick charts are the professional standard. Each candle body shows the range between open and close. Green bodies mean the price closed higher than it opened. Red bodies mean the opposite. The thin lines above and below, called wicks, show where the price traveled before pulling back.
Trend Lines, Support, and Resistance
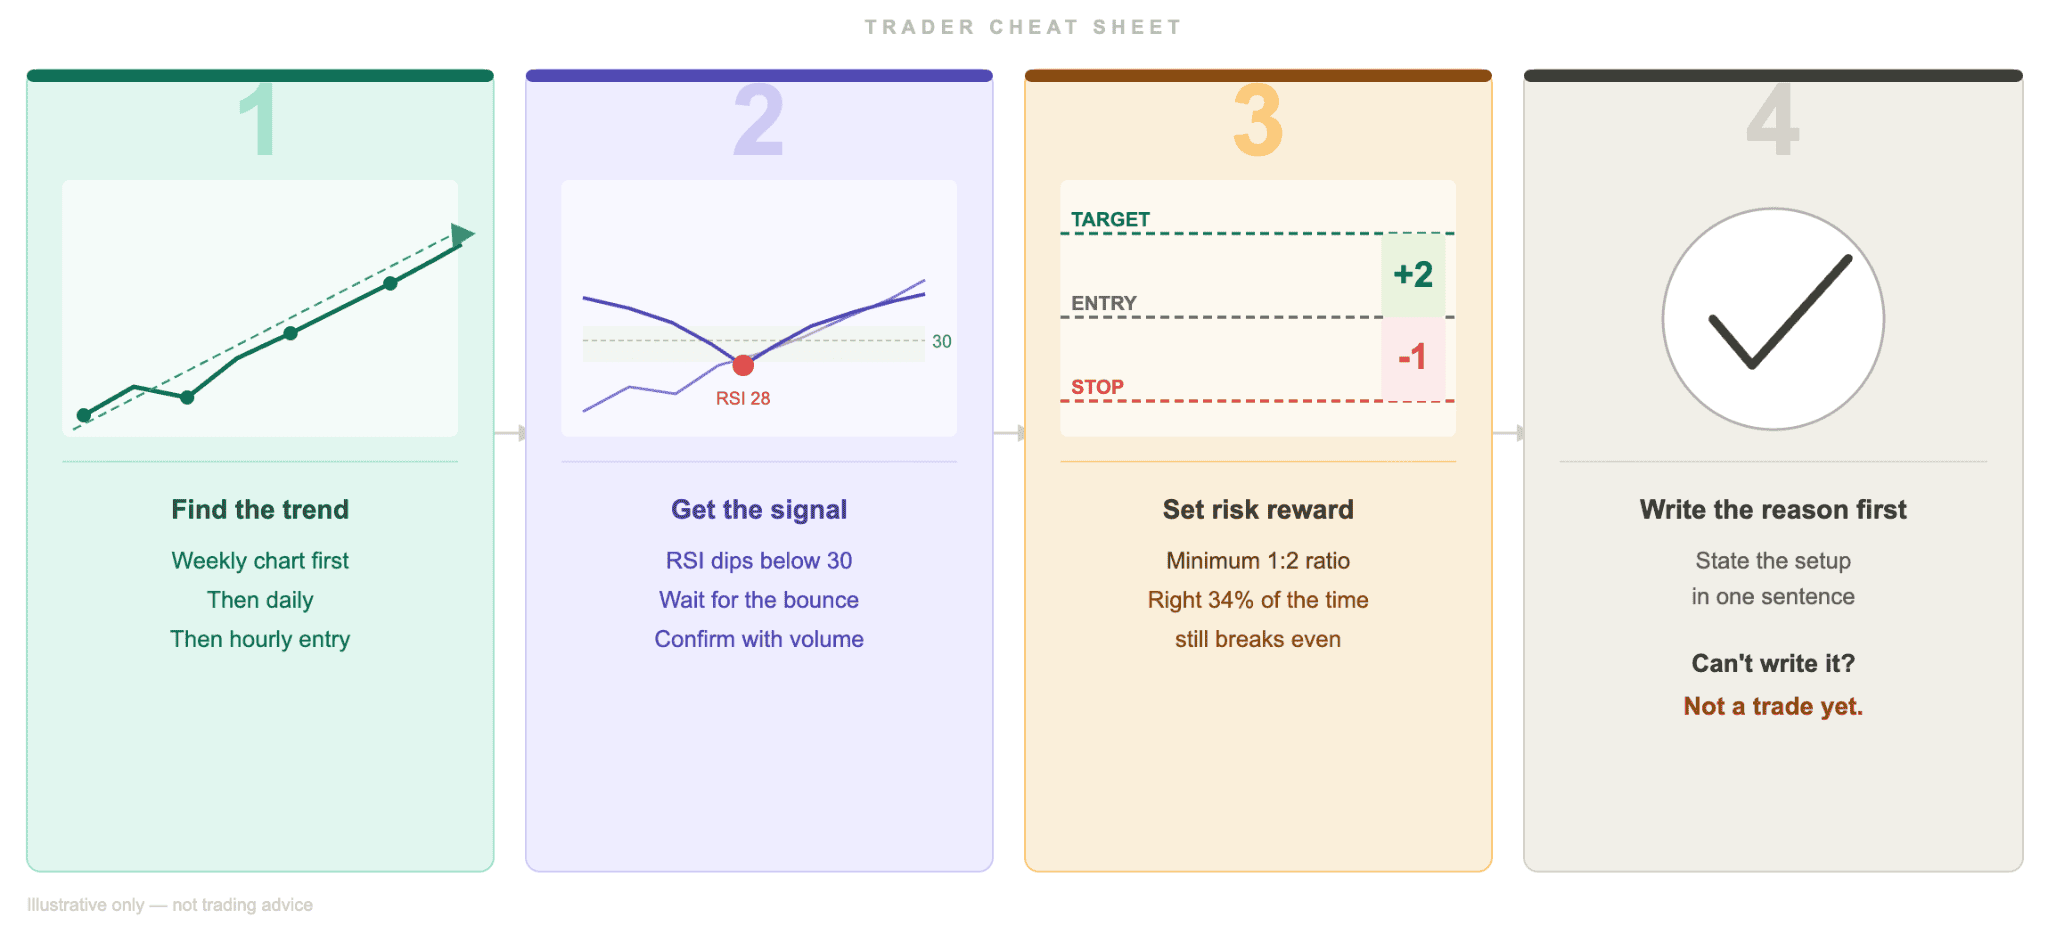
A trend line connects a series of higher lows in an uptrend or lower highs in a downtrend. Its slope shows both direction and momentum. When price breaks a trend line on rising volume, traders treat that as a signal worth acting on.
Support is a price level at which buyers have historically appeared in sufficient numbers to stop the price from falling further. Resistance is where sellers have historically held the upper hand. The more times a price has tested and respected a level, the more significant that level becomes for participants watching it.
Price Patterns That Repeat
Price patterns fall into two groups. Continuation patterns, such as flags and triangles, suggest the existing trend will resume after a consolidation period. Reversal patterns, such as head-and-shoulders or double tops, signal a potential change in direction.
No pattern produces a guaranteed outcome. Pattern reliability increases sharply when three conditions align: the pattern forms at a key support or resistance level, volume confirms the move, and the pattern aligns with the higher-timeframe trend. Breakout trading strategies built on this logic showed a 30% success rate across surveyed traders, making them among the more consistent short-term approaches.
Key takeaway: Charts record every market decision made over a given period. Candlestick charts are the professional standard. 66% of active traders use daily charts as their primary timeframe for analysis.
Indicators, Signals, and Stock Technical Analysis Tools
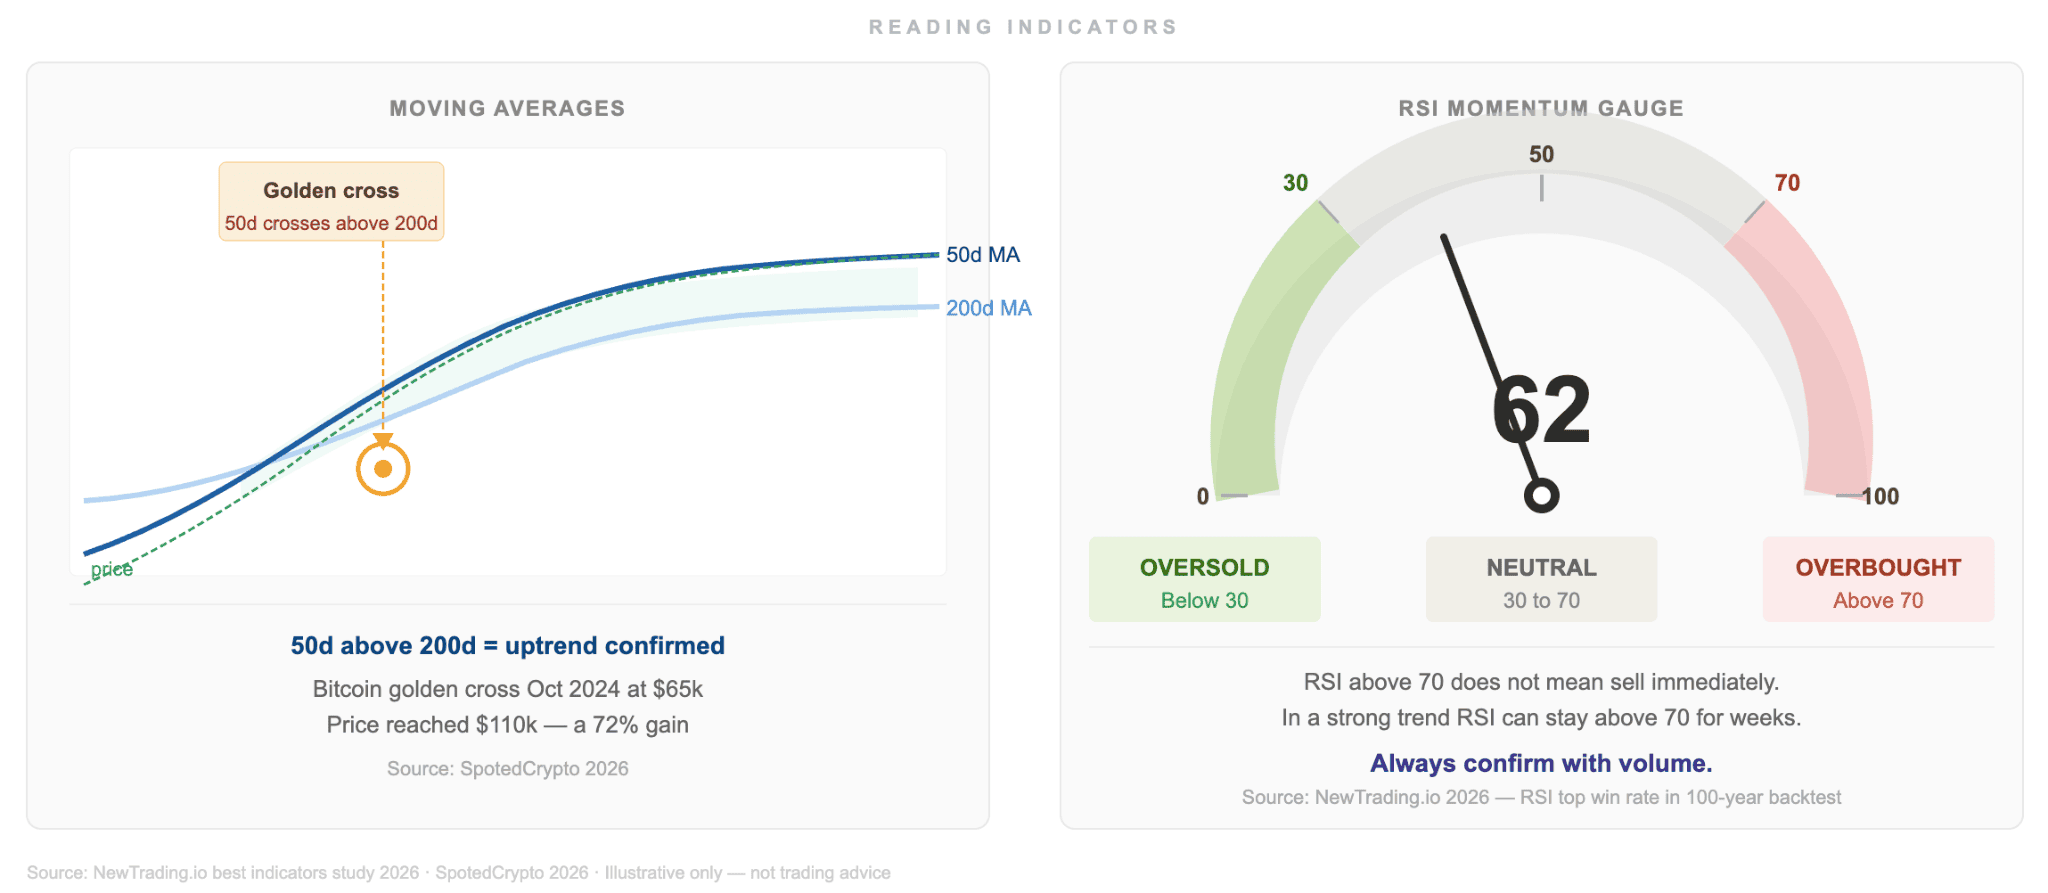
Indicators are mathematical calculations applied to price and volume. They do not predict the future. They organize historical data into formats that make trends and momentum easier to identify. Stock technical analysis uses these tools to find entry and exit points with more precision than reading price alone.
The danger is using too many. Traders who overload charts with overlapping indicators produce conflicting signals and hesitation. The research is detailed: combining complementary indicator types produces more reliable results than stacking similar ones.