Technical Analysis

Sep 3, 2025 - 5 min

Beginner

Updated: May 21, 2026

Renko Charts Explained: How They Work and How to Trade Them

Renko Charts Explained: How They Work and How to Trade Them

Traders who struggle with noisy, time-based charts often miss clean trend signals buried under random price fluctuations. Renko charts strip away that noise by recording only meaningful price moves, giving you a clearer read on market direction. This guide explains what a renko chart is, how to set it up, and how to build a working renko trading strategy from scratch.

Justin Freeman
Reviewed by:
Share

Renko Charts at a Glance: Key Facts

QuestionAnswer
What is a renko chart?A price chart built from fixed-size bricks that form only when price moves a set amount
Where do renko charts come from?Japan; introduced to Western traders by Steve Nison in his 1994 book Beyond Candlesticks 
What does "renko" mean?From the Japanese word renga, meaning "brick"
What determines a new brick?Price must move the full brick size from the prior brick's close to form a new one
How is brick size set?Fixed point value, ATR (Average True Range), or percentage of asset price
What markets use renko charts?Stocks, forex, commodities, indices, crypto


What Is a Renko Chart?

A renko chart is a price chart that ignores time and records only price movement. Each rectangular brick forms only when price moves a predetermined amount. When price fails to reach that threshold, no new brick appears, and the chart stays unchanged.

The result is a chart that filters out minor fluctuations and draws your attention to the direction the market is actually moving. This makes trend identification faster and reduces the number of false signals you see on standard candlestick or bar charts.

The Brick Mechanic: How a New Bar Forms

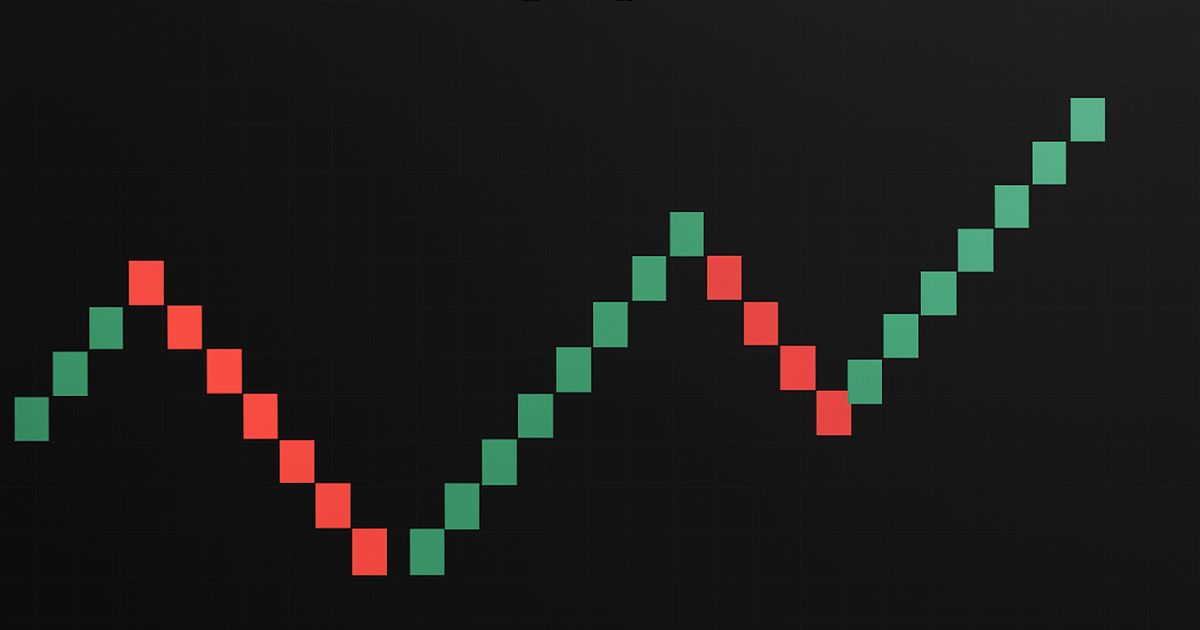
Each renko brick connects to the corner of the previous one at a 45-degree angle. An upward brick forms when price closes at least one full brick size above the top of the last brick. A downward brick forms when price closes at least one full brick size below the bottom of the last brick.

A reversal brick requires twice the brick size to form, because price must first pass through the current brick and then complete a full brick in the opposite direction. Upward bricks are typically colored green or white. Downward bricks are colored red or black.

Two rules govern every renko chart: no two bricks can appear side by side in the same column, and a brick only confirms when the price movement is complete, not while it is still forming.

Renko vs Candlestick Charts: Key Differences

The table below shows the practical difference between the two chart types.

FeatureRenko ChartCandlestick Chart
Time axisNo fixed time axisFixed intervals (1m, 1h, 1d, etc.)
New bar conditionPrice moves set amountNew time period begins
Wicks/shadowsNonePresent
Noise filteringHighLow to medium
Trend clarityStrongModerate
Signal frequencyLowerHigher
Backtesting reliabilityRequires caution (look-ahead bias risk)Standard

Candlestick charts give you more data points per session. Renko charts give you fewer, cleaner signals. The trade-off is signal frequency versus signal quality.

Key Takeaway: A renko chart builds one new brick only when price moves a set distance, regardless of how long that takes. This removes time from the equation and keeps your focus on price structure. Upward bricks are green or white, downward bricks are red or black. Reversal bricks require twice the brick size to form.

How to Set Your Renko Brick Size

The brick size is the single most important setting on a renko chart. Set it too small, and you get a cluttered chart full of reversals. Set it too large, and you miss entries. Three methods cover most use cases. 

Most traders start with ATR-based sizing because it adapts to current market conditions automatically. Fixed and percentage methods work better when you want consistent, predictable signal behavior across different market phases.

Fixed Value Brick Size

A fixed brick size stays constant regardless of how volatile the market becomes. If you set a 10-point brick on an index, every brick always represents exactly 10 points of price movement. This approach suits traders who want predictable risk per brick and a stop-loss size they can calculate in advance.

The drawback is that a fixed size set during a low-volatility period will produce too many bricks during high-volatility conditions, and vice versa.

ATR-Based Brick Size

The renko indicator most widely used for brick sizing is the Average True Range (ATR), typically calculated over 14 periods. The ATR value at chart creation becomes the brick size. If ATR reads 20 points, each brick represents 20 points of movement.

StockCharts uses ATR to auto-set brick size, keeping the chart aligned with current volatility levels. Smaller brick values relative to ATR produce more signals. Larger values produce fewer, smoother trends. Dividing ATR by 2 increases sensitivity; multiplying by 2 reduces it.

Percentage of Asset Value

Some traders set brick size as a percentage of the asset's current price, typically between 0.25% and 1%. This method scales naturally as asset prices change over time. A 0.5% brick on a $50,000 asset equals $250 per brick. On a $5,000 asset, the same percentage produces a $25 brick.

Become a Confident Trader

Master trading with our structured course designed for beginners and intermediate traders.

Step-by-step lessons
Real strategies
Risk management training

Join 10,000+ traders improving their skills

Start Course Now

This approach works well for assets with wide price ranges, such as Bitcoin or high-priced equities, where a fixed point value would be meaningless.

Key Takeaway: ATR-based brick sizing is the most adaptive method because it adjusts to changing volatility. Fixed values give you predictable stops. Percentage sizing works best for high-priced or highly variable assets. Start with a 14-period ATR value and adjust sensitivity from there.

How to Read Renko Chart Signals

Reading a renko chart means watching brick color, sequence, and position relative to prior price levels. A single brick tells you direction. A sequence of same-color bricks tells you trend strength. A color change tells you the trend has reversed or paused.

Three types of information matter on any renko chart: the direction of the current sequence, the location of likely support and resistance, and recognizable brick patterns that repeat across markets.

Trend Direction and Color Shifts

A clear trend on a renko chart is a sequence of same-color bricks stacking in one direction. During an uptrend, you see consecutive green bricks with no interruption. The trend ends when the first opposite-color brick completes. 

A trader using a Renko chart on USDJPY with a 100-pip brick during late 2024 to early 2025 would have captured extended directional moves by holding through the green or red brick sequences and exiting only when the opposing color confirmed. The key discipline is waiting for the brick to close before acting, since an unconfirmed brick forming in real time can reverse before completing.

Support and Resistance on a Renko Chart

Support and resistance appear on renko charts as price levels where reversals have repeatedly occurred. Because bricks form only on significant moves, the turning points you see on a renko chart represent genuine price reactions, not random noise.

Horizontal levels where multiple brick sequences have started or ended carry more weight than those where reversals happened only once. These levels remain valid until price closes a full brick beyond them.

Common Renko Patterns

Three brick patterns appear frequently across different markets and timeframes:

  • Three or more consecutive bricks in one direction (strong trend signal)
  • A single opposing brick followed by a return to the original color (pullback and continuation)
  • Alternating colors with no clear sequence (consolidation or choppy conditions)

Consolidation phases on a renko chart produce alternating brick colors with no extended run in either direction. These phases are the weakest environment for renko trading strategies. Waiting for a clear three-brick sequence in one direction before entering avoids most of these false starts.

Key Takeaway: Trend strength on a renko chart is measured by the number of consecutive same-color bricks. A single opposite-color brick does not confirm a reversal. Consolidation phases produce alternating bricks and are best avoided. Wait for three consecutive bricks in a direction before committing to a position.

Renko Trading Strategy: Three Practical Approaches

A renko trading strategy works best in trending markets. The chart type was built for that environment. In choppy, sideways conditions, any renko-based approach will produce losses as the chart flips between brick colors repeatedly. 

The three approaches below cover the most practical ways to trade renko charts, from the simplest to the most refined.

Trend-Following with Brick Color Changes

The most direct renko strategy uses brick color changes as entry and exit signals. You buy when the first green brick completes after a red sequence. You sell short when the first red brick completes after a green sequence. 

This approach keeps you in the trend for as long as bricks continue in one direction. The cost is giving back part of the move before the reversal brick confirms. A trader applying this method to the Euro 50 Index during an extended uptrend in a prior year could have stayed in the trade through 11 consecutive 35-point green bricks, capturing 385 points before the first red brick appeared. The approach works when trends are strong and sustained.

Renko with Moving Averages

Adding a moving average to a renko chart improves entry timing. When bricks form above the moving average, you look for long entries only. When bricks form below it, you look for short entries only. This filter keeps you aligned with the dominant trend and avoids taking countertrend signals.

A 20-brick moving average works well on most instruments as a starting point. Adjust the period based on how much lag you are willing to accept versus how much noise you want to remove.

Renko as a Trailing Stop

Renko charts work as a trailing stop mechanism without any additional indicators. You hold a long position as long as new green bricks keep forming. The moment a red brick confirms, you exit. This approach captures the majority of a trend move while giving up only the final brick of movement before the reversal confirms. 

In low-liquidity markets, where price swings can appear random on standard charts, the renko trailing stop approach removes most of the intraday noise and lets the underlying trend dictate your exit. 

Key Takeaway: The simplest renko strategy is entering on a brick color change and exiting on the next opposing brick. Adding a moving average filter improves signal quality by keeping you on the right side of the dominant trend. Using renko as a trailing stop is effective in strong trending conditions across any liquid market.

Renko Chart Pros and Cons

No chart type is suitable for every situation. Renko charts have a specific set of strengths and a specific set of limitations. Understanding both prevents you from applying this tool where it does not belong.

AdvantageLimitation
Removes market noise effectivelyLags behind fast price moves
Makes trends visually clearPerforms poorly in choppy markets
Works as a built-in trailing stopReversal brick requires double the brick size
Reduces false signals vs candlesticksBacktesting carries look-ahead bias risk
Works across all liquid marketsDoes not show volume or session structure
Simplifies entry and exit decisionsBrick size selection requires calibration

The backtesting limitation deserves attention. Renko charts can produce equity curves that look significantly better in backtests than they perform in live trading. This happens because the chart may record entries and exits at prices that did not exist in real time. Any strategy tested on renko data should be validated against live or forward-tested results before being applied with real capital.

Key Takeaway: Renko charts are a strong tool for trend traders in markets with directional movement. Their main limitation is performance in sideways conditions and the difficulty of reliable backtesting. Use them alongside volume data or a secondary indicator to compensate for what the chart type does not show.

Key Takeaways: What You Need to Know About Renko Charts

A renko chart forms one new brick for every set amount of price movement, ignoring time entirely. Brick size drives everything: set it with ATR for adaptability, a fixed value for predictable stops, or a percentage for assets with wide price ranges. Renko charts work best in trending markets and struggle when price moves sideways. The most reliable renko trading approaches combine brick color signals with a trend filter such as a moving average. Always validate any renko-based strategy with forward testing before trading it with real capital.

Frequently Asked Questions

Disclaimer: This article is for informational purposes only and does not constitute financial advice. Trading involves risk and may result in loss of capital.

Related Articles

The First Move Is Yours

Discover how Supertrade can transform your trading career. Explore challenges, access instant funding, and join a growing community of Supertraders.

Stay Ahead of the Game

Sign up to receive exclusive tips, market insights, and the latest updates from Supertrade. Don’t miss out on opportunities to grow your trading success.
Discord

Our Community

Do not skip any beat.

The Ultimate Trading Community. Join our Discord server to get the latest updates, news and more.

2026 Supertrade. All rights reserved
DiscordInstagramTelegramYouTubeX
Trading involves significant risk. Past performance is not indicative of future results. This is a simulated trading environment. Supertrade provides educational trading services.
Supertrade
Supertrade Ltd, a company incorporated under the laws of Saint Lucia with registered number 2024-00699, located at Ground Floor, Rodney Court Building, Rodney Bay, Gros Islet, Saint Lucia, LC01 101, operates and owns this website, as well as provides services under the Terms and Conditions posted on the website. Supertrade Prop Ltd, a company incorporated under the laws of England and Wales with registered number 16234284, located at 52-56 Standard Road, London, England, NW10 6EU, acting as a payment agent.