
Simple Moving Average: How to Read It and Trade It Effectively
Most traders look at price and see noise. The Simple Moving Average (SMA) cuts through that noise. It shows the average price over a chosen period. This article covers SMA calculation, period selection, and the three signals traders use to read trend direction every day.
11 min

What Is Technical Analysis in Trading
Price charts hold more information than most traders ever use. Technical analysis (TA) is how traders turn price, volume, and momentum into actionable signals. A survey of Hong Kong FX dealers found that over 85% used both fundamental and technical analysis. This 2026 guide shows you how to read TA and use it to improve your results on different markets.
12 min


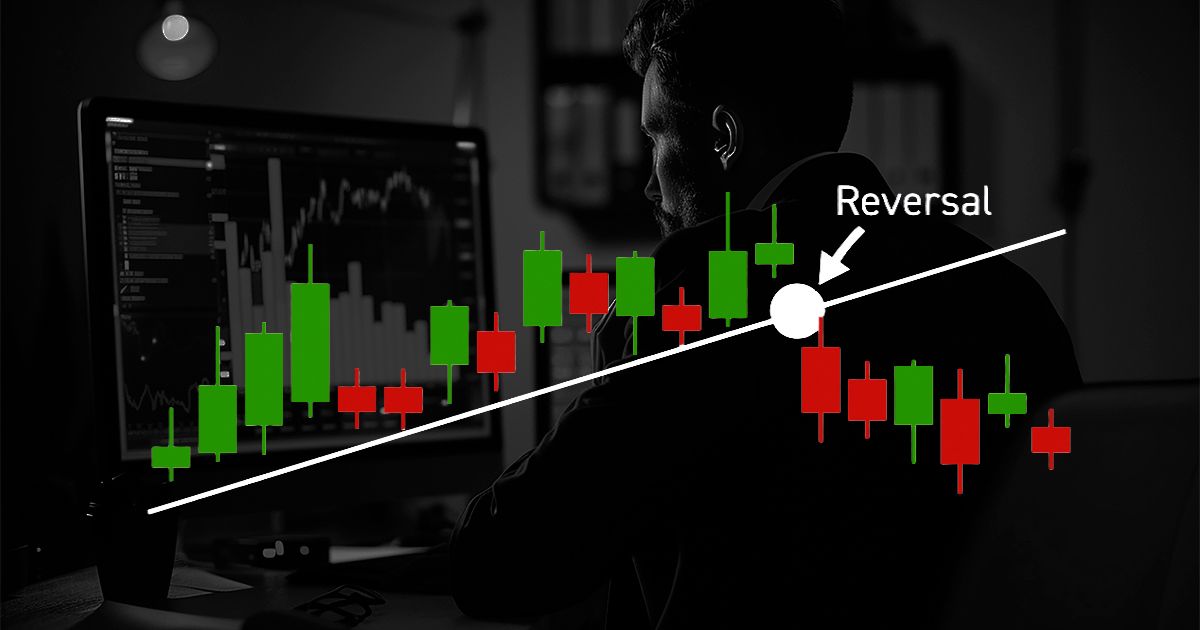
How to Identify a Trend Reversal in Stocks and Forex
A market reversal does not announce itself. Price shifts direction, and most traders only notice after the move is already underway. This guide breaks down what a trend reversal is, how to identify one in real time using price structure and indicators, and how to separate a genuine shift from a temporary pullback that traps traders on the wrong side.
5 min
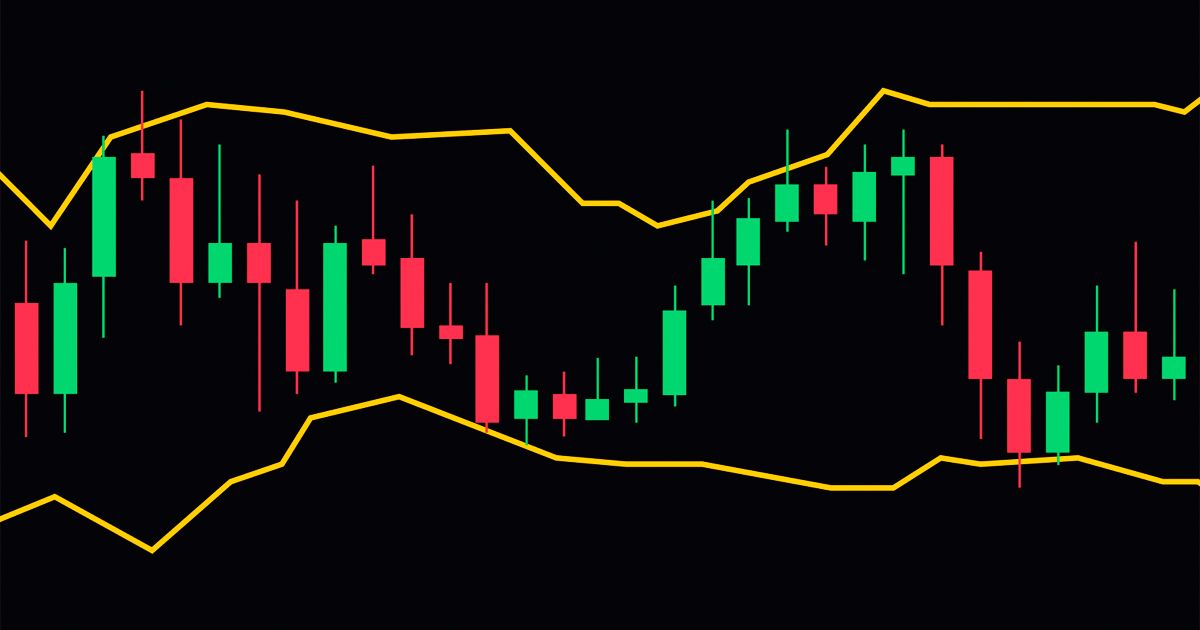
Renko Charts Explained: How They Work and How to Trade Them
Traders who struggle with noisy, time-based charts often miss clean trend signals buried under random price fluctuations. Renko charts strip away that noise by recording only meaningful price moves, giving you a clearer read on market direction. This guide explains what a renko chart is, how to set it up, and how to build a working renko trading strategy from scratch.
5 min

MACD Explained: How to Read and Use the Moving Average Convergence Divergence Indicator
The moving average convergence divergence indicator is one of the most widely used tools in technical analysis. Traders apply it across stocks, forex, futures, and crypto to measure momentum and spot trend changes before they fully develop. This guide breaks down exactly how MACD works, what each signal means, and where the indicator falls short.
11 min
Best Indicators on TradingView in 2026 (Top Picks Tested and Compared)
TradingView now serves over 100 million registered users across 180 countries. Finding the best indicators on TradingView among 150,000 community scripts takes real research and testing. This guide ranks the top built in and free options for 2026. You will learn which tools match your trading style and how to combine them for stronger analysis.
9 min

How Auction Market Theory Helps Traders Read Price, Value, and Volume
Most traders watch price charts without understanding why prices move. Auction market theory gives you a framework to read the real forces behind every price change. This article breaks down how the auction process works, what tools to use, and how to spot opportunities where others see noise.
12 min
