Technical Analysis

May 20, 2026 - 11 min

Beginner

Simple Moving Average: How to Read It and Trade It Effectively

Simple Moving Average: How to Read It and Trade It Effectively

Most traders look at price and see noise. The Simple Moving Average (SMA) cuts through that noise. It shows the average price over a chosen period. This article covers SMA calculation, period selection, and the three signals traders use to read trend direction every day.

Justin Freeman
Reviewed by:
Share

Five Things Every Trader Should Know About SMA

Before getting into mechanics, here are the key facts to remember:

  • SMA averages closing prices
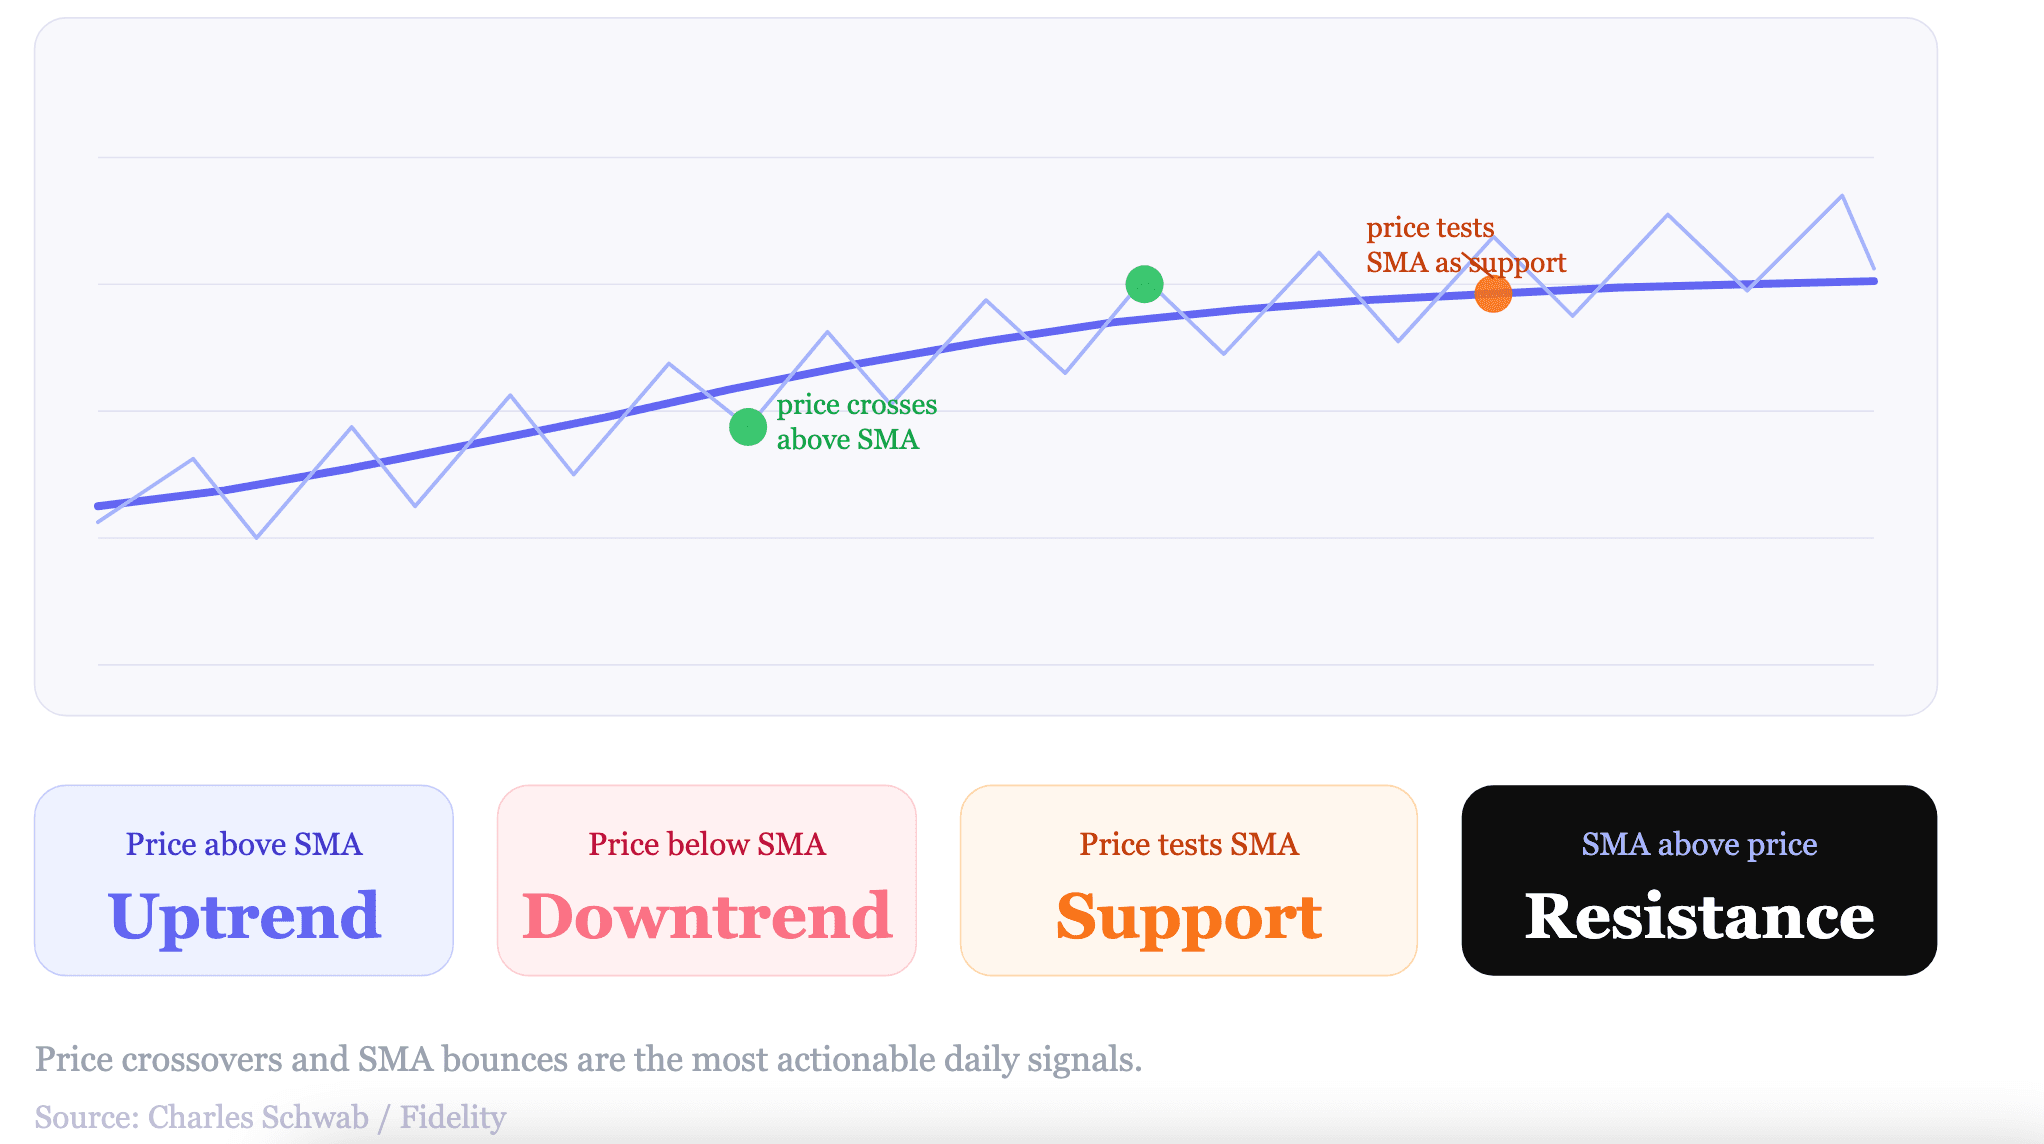
  • Rising SMA signals an uptrend
  • Falling SMA signals a downtrend
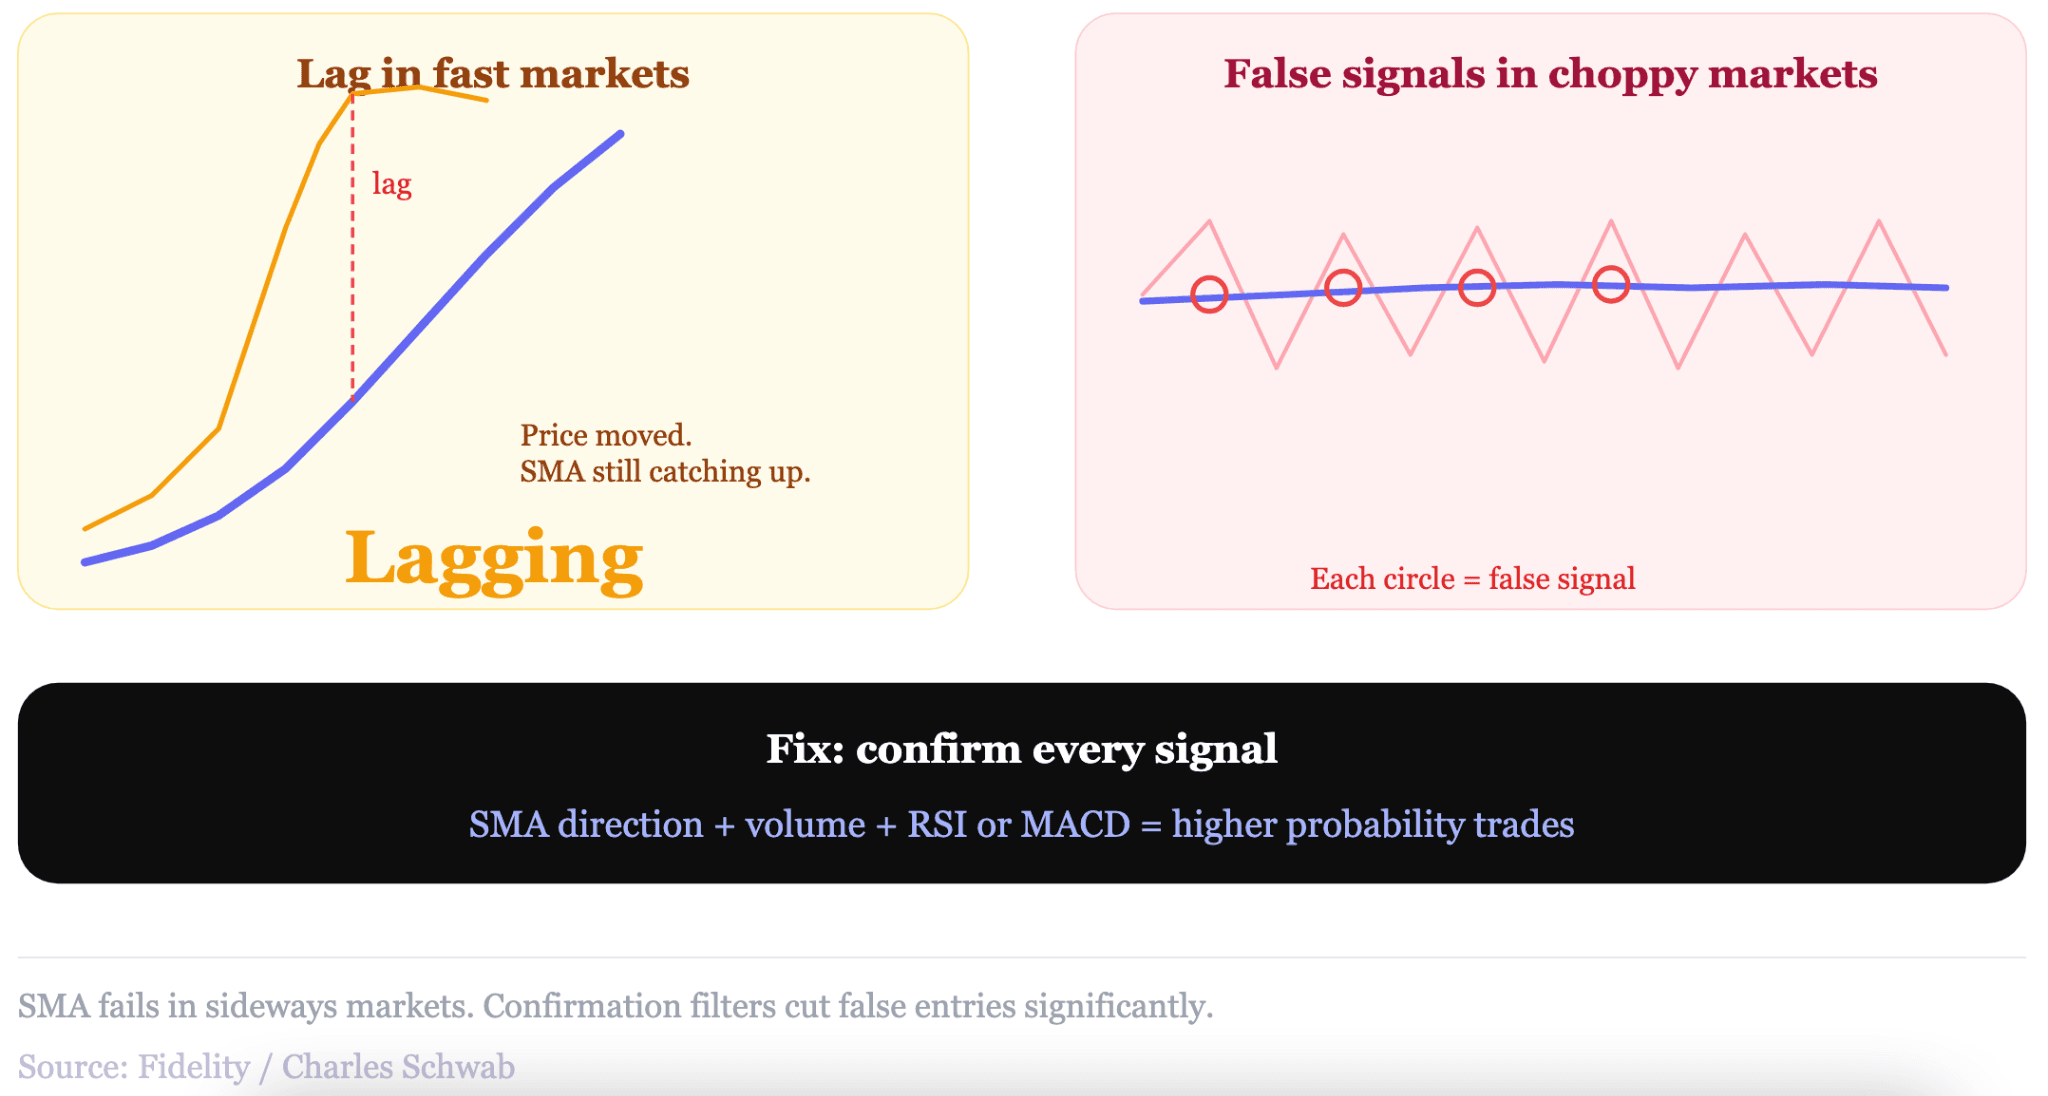
  • SMA is a lagging indicator
  • Short periods react fast, long periods run smoothly

The most common SMA periods are 10, 20, 50, 100, and 200 days. Fidelity describes SMA as the easiest moving average to construct in technical analysis. The 200-day SMA is the standard long-term benchmark used by institutional traders worldwide.

Key takeaway: Most traders spend more time picking entries than picking periods—the period you choose shapes every signal SMA gives you. Get the period wrong, and the tool works against you, not for you.

What Is the SMA Indicator

What Is the SMA Indicator

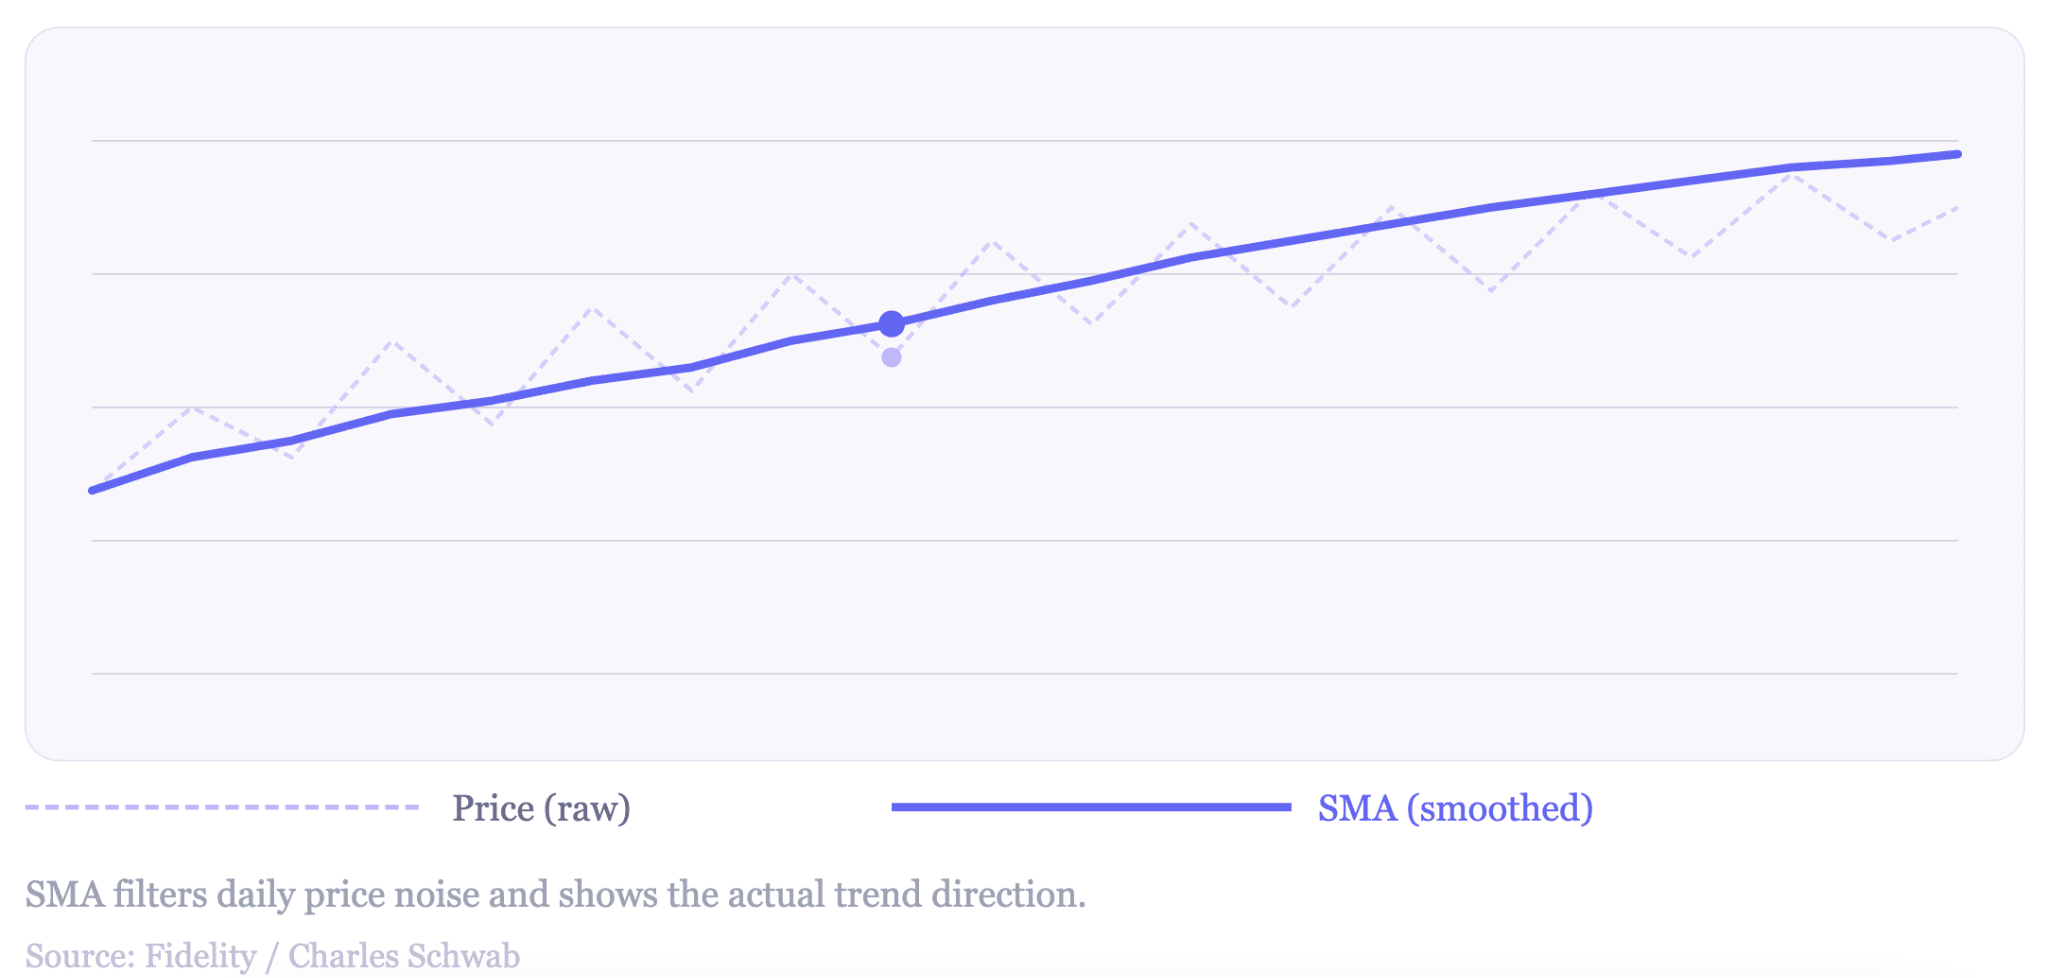
The SMA indicator shows the average closing price of an asset over a chosen number of periods. Each new bar adds the latest price and drops the oldest one. Fidelity explains that SMA forms a line that moves along the chart as the average value changes. That moving line is what traders use to read trend direction, spot support and resistance, and time entries and exits.

Charles Dow used moving averages to analyze stock market trends in the early 1900s. That makes SMA one of the oldest tools in technical analysis. Its logic has not changed since then.

SMA Formula and Calculation Step by Step

SMA Formula and Calculation Step by Step

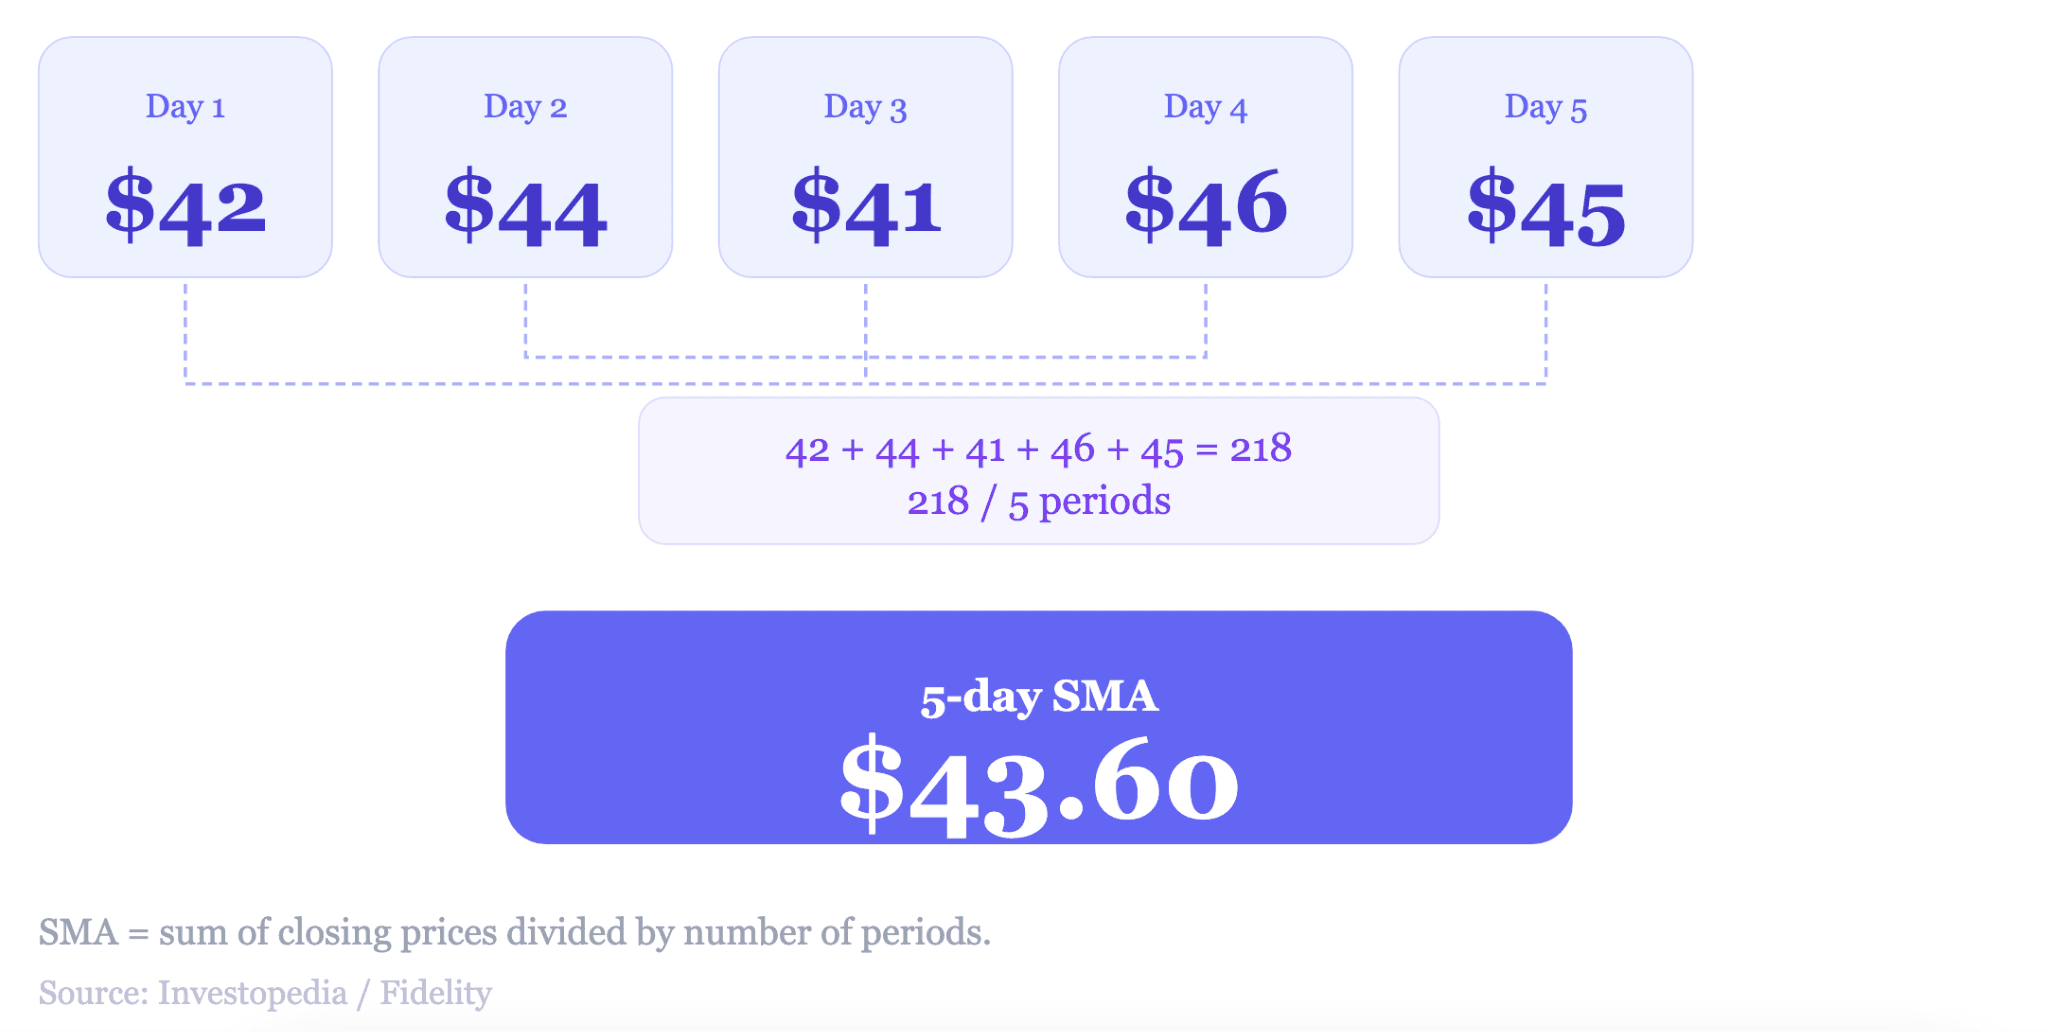
The Simple Moving Average formula is straightforward. Divide the sum of closing prices by the number of periods. Take a stock that closes at $42, $44, $41, $46, and $45 over five days. Add those prices together, and you get $218. Divide by 5, and the SMA lands at $43.60. 

On Day 6, the price closes at $48, and Day 1 drops out. The new five-day SMA becomes $44.80. The average shifts forward one period with every bar. Shorter periods follow the price closely. Longer periods smooth it out. Both use the same formula, and only the number of periods changes.

SMA vs EMA

SMA gives equal weight to every price in the chosen period. The exponential moving average places more weight on recent prices, making it react more quickly to new data. For short-term trading, EMA signals arrive earlier. For longer-term trend reading, SMA produces cleaner lines with fewer false entries. 

Charles Schwab notes that SMA works better as a trend indicator on daily charts. It's built-in lag smooths price action over time. Most traders run both on the same chart. EMA for timing entries. SMA for reading the broader trend.

"Pick the period that matches how long you actually hold a trade, not how fast you want to be right." 

Key takeaway: SMA is the arithmetic mean of closing prices updated bar by bar. What most traders miss is that the period is not a default setting. It is a decision that reflects your time horizon. Change the period, and you change what the indicator tells you entirely.

Best SMA Period for Your Trading Style

Best SMA Period for Your Trading Style

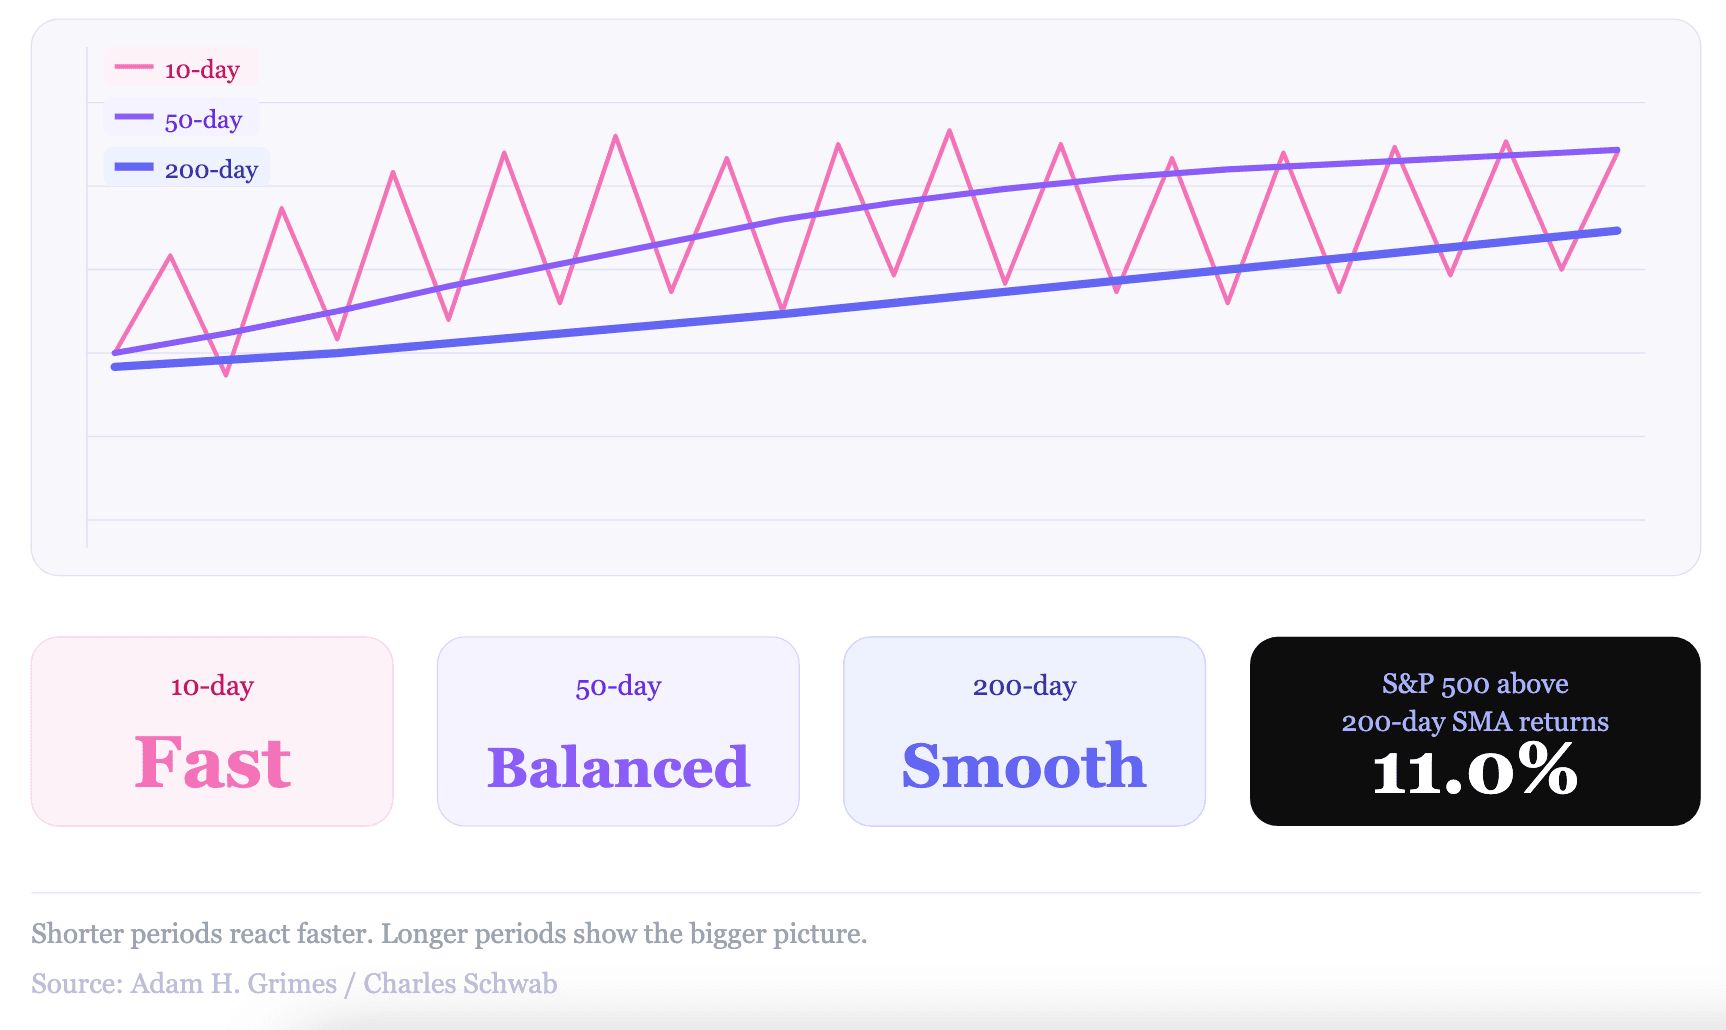
Choosing the right SMA period is the decision most traders get wrong first. Shorter periods react faster but generate more noise. Longer periods run cleaner but lag behind price. The right period depends on how long you plan to hold a position. Charles Schwab puts it directly: your trading time horizon determines which SMA period gives you useful information.

Short-Term SMA Periods 10 and 20 Days

The 10-day and 20-day SMAs track recent price momentum. They suit traders who hold positions for days or weeks. A rising 10-day SMA tells you buyers controlled the last two trading weeks. When price pulls back to the 20-day SMA and holds, that level often acts as a buying zone. 

Become a Confident Trader

Master trading with our structured course designed for beginners and intermediate traders.

Step-by-step lessons
Real strategies
Risk management training

Join 10,000+ traders improving their skills

Start Course Now

The trade-off is noise. In sideways markets, short-term SMAs cross price repeatedly with no real trend behind them. Always confirm short-period signals with volume or a longer SMA running in the same direction.

Long-Term SMA Periods 50 and 200 Days

The 50-day and 200-day SMAs define the levels that move institutional money. Fund managers and algorithmic systems closely monitor the 50-day SMA. When the price holds above it for weeks, the market is in a sustained move. The 200-day SMA is the benchmark for long-term trend direction. 

Historical data on the S&P 500 show that when the price trades above the 200-day moving average, the index returns 11.0% annualized. When it trades below that figure, it drops to 2.1%. Hedge fund manager Paul Tudor Jones named the 200-day moving average as his primary metric for every market he trades.

SMA PeriodBest ForReactionRisk
10-dayShort-term tradersVery fastHigh false signal rate
20-daySwing tradersFastNoise in sideways markets
50-dayMedium-term followersModerateLags turning points
200-dayPosition tradersSlowSignals arrive late

Key takeaway: The 10-day SMA and the 200-day SMA are not two versions of the same tool. They answer different questions. The 10-day asks what happened this fortnight. The 200-day asks what the market has been doing for most of the year. Use them accordingly.

How to Read SMA Signals in Live Trading

How to Read SMA Signals in Live Trading

The SMA indicator generates three types of signals that traders act on every day. Each one tells a different story about the market. Knowing all three turns SMA from a background line into a tool that earns its place on the chart.

Golden Cross and Death Cross

Golden Cross and Death Cross

The golden cross happens when the 50-day SMA crosses above the 200-day SMA. Traders read this as a shift toward bullish momentum. A backtest of the S&P 500 from 1960 onward found a 79% win rate. That covered 33 golden cross signals over 66 years. The death cross is the opposite. The 50-day SMA crosses below the 200-day SMA, signaling that short-term momentum has turned negative. 

Research by Quantifiable Edges covering 97 years of S&P 500 data found that 73.5% of death cross periods ended higher. The losing trades were rare but very large in size. Neither signal works as a mechanical buy or sell trigger on its own. Fidelity notes that crossover signals are infrequent and that market volatility can lead to abnormal crossover activity. Use them as context, not commands.

"The death cross scared a lot of traders out of positions in April 2025. The market recovered within weeks. The signal flagged a risk environment, not a certainty. That is exactly how you should use it."

Price Crossing the SMA Line

When the price crosses above the SMA, buyers take control. When the price crosses below, sellers do. This is the most frequent SMA signal and the most misused one. The key is what the SMA itself does at the moment of the cross. 

If the SMA rises and the price crosses above it, that confirms the uptrend. If the SMA sits flat and price crosses above it, the signal is weak. Short-period SMAs generate more crossovers. Long-period SMAs generate fewer but more significant ones. Watch both the crossover and the slope of the SMA line before acting on any signal.

SMA as Dynamic Support and Resistance

The 20-day, 50-day, and 200-day SMAs act as moving support and resistance levels. Price often pulls back to these levels during a trend and then bounces. When an SMA runs below the current price, it acts as support. When it runs above the current price, it acts as resistance. 

Charles Schwab explains that when an SMA acts as support, it runs below the stock price, acting as a floor. When price tests it, it rebounds. The 200-day SMA attracts the most attention at these levels. When enough market participants watch the same line, reactions to it become stronger and more consistent.

Key takeaway: Three signals, three different reads on the same chart. The golden cross indicates the trend regime. The price crossover indicates short-term momentum. The support and resistance bounce tells you where buyers and sellers make their stand. Read all three before acting on any one.

Limitations Every SMA Trader Needs to Accept

Limitations Every SMA Trader Needs to Accept

SMA has real weaknesses, and ignoring them costs money. The indicator runs on historical data only. By the time a signal appears, part of the move has already happened. In fast markets, this lag makes entries late and exits slow.

When SMA Fails in Choppy and Sideways Markets

In sideways conditions, SMA fires false signals repeatedly. The line crosses price, traders act, and the trend never shows up. This happens because SMA works best when price trends. 

When the price moves sideways, the average stays flat, and every minor swing above or below it looks like a signal. Shorter periods suffer most here. A 10-day SMA in a choppy market fires crossover signals multiple times a week with no follow-through. A 200-day SMA in the same conditions barely moves and stays mostly irrelevant.

How to Filter False SMA Signals

The fix is confirmation. Do not act on an SMA signal without checking volume first. A price crossover on above-average volume carries weight. The same crossover on thin volume usually fades. Add a momentum indicator such as RSI or MACD as a second filter. 

When RSI confirms the direction of the SMA signal, the probability of follow-through increases. Use the longer SMA as a directional filter for the shorter one. Only take buy signals from the 20-day SMA when the price sits above the 200-day SMA. That one rule alone cuts a significant number of false entries in flat markets.

Key takeaway: SMA fails in sideways markets because it was built for trending ones. The solution is not to find a better SMA period. The solution is to confirm every signal with volume and at least one momentum indicator before committing to a trade.

Conclusion

The Simple Moving Average is the arithmetic mean of closing prices over a set period. Rising SMA confirms an uptrend. Falling SMA confirms a downtrend. The 50-day and 200-day SMAs are the most-watched periods in institutional trading. Their crossover produces the golden cross and death cross signals. 

SMA lags price because it runs on historical data. That lag is a feature in trending markets and a liability in choppy ones. Used alongside volume and momentum tools, SMA remains one of the most reliable trend-reading instruments available.

Frequently Asked Questions

Disclaimer: This article is for informational purposes only and does not constitute financial advice. Trading involves risk and may result in loss of capital.

Related Articles

The First Move Is Yours

Discover how Supertrade can transform your trading career. Explore challenges, access instant funding, and join a growing community of Supertraders.

Stay Ahead of the Game

Sign up to receive exclusive tips, market insights, and the latest updates from Supertrade. Don’t miss out on opportunities to grow your trading success.
Discord

Our Community

Do not skip any beat.

The Ultimate Trading Community. Join our Discord server to get the latest updates, news and more.

2026 Supertrade. All rights reserved
DiscordFacebookInstagramTelegramYouTubeXTikTok
Trading involves significant risk. Past performance is not indicative of future results. This is a simulated trading environment. Supertrade provides educational trading services.
Supertrade
Supertrade Ltd, a company incorporated under the laws of Saint Lucia with registered number 2024-00699, located at Ground Floor, Rodney Court Building, Rodney Bay, Gros Islet, Saint Lucia, LC01 101, operates and owns this website, as well as provides services under the Terms and Conditions posted on the website. Supertrade Prop Ltd, a company incorporated under the laws of England and Wales with registered number 16234284, located at 52-56 Standard Road, London, England, NW10 6EU, acting as a payment agent.