En
En Es
Es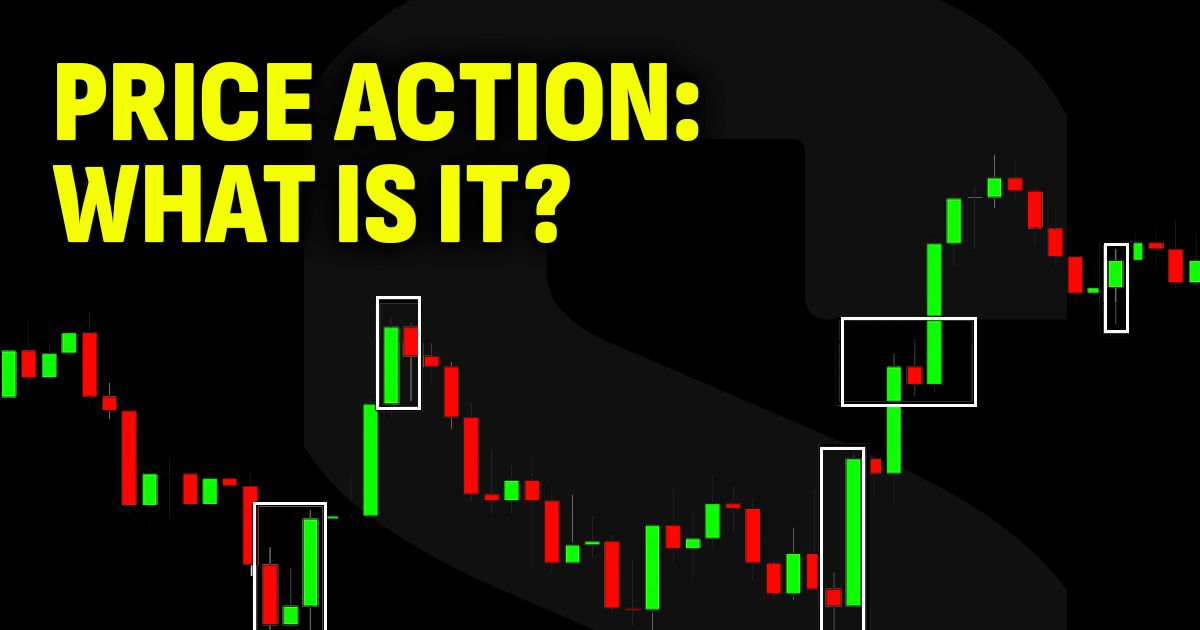

Price Action at a Glance Key Facts
| Question | Answer |
|---|---|
| What is price action | The study of raw price movement on a chart to make trading decisions without indicators |
| What is PA in trading | PA stands for price action, a method of reading candlestick patterns, trends, and key levels directly |
| Does price action work in all markets | Yes, it applies to stocks, forex, crypto, and futures on any timeframe |
| What is the success rate | Some price action strategies report win rates of 60% to 75% depending on skill and market conditions (xs.com) |
| Do professional traders use it | Yes, institutional and prop firm traders rely on price action as their primary analysis method |
| Can beginners learn it | Yes, but it requires practice with candlestick reading, support and resistance, and trend identification first |
What Is Price Action Trading
Raw price movement is the foundation of all technical analysis. Every indicator on every platform takes its data from one source. That source is price itself. Price action trading removes the processed layer and reads the original data directly from the chart.
Price Action Meaning in Simple Terms
The concept refers to the movement of an asset's price over time, displayed on a chart. In a narrow sense, price action definition covers specific candlestick patterns like pin bars, inside bars, and engulfing candles. In a broader sense, it includes all chart structures that reveal buyer and seller behavior.
Traders who use this method study "clean" or "naked" charts. They remove oscillators and overlays to focus on what price is doing right now. The goal is to identify repeating patterns that signal where price is likely to move next.
Why Traders Use PA Instead of Indicators
Indicators process past data. They always lag behind the current price. A moving average tells you where price was, not where it is going.
Price action analysis reads the market in real time. It shows the actual battle between buyers and sellers as it happens. A study published in the Journal of Financial Markets (2021) found that common price action patterns show statistically significant predictive power when combined with key support and resistance levels (avatrade.com/education/online-trading-strategies/price-action-trading).
Professional traders at prop firms and hedge funds favor this approach for three reasons.
- Faster decision making
- No indicator conflicts
- Works on any timeframe
These advantages explain why PA remains the preferred method in institutional trading desks around the world.
Key Takeaway: Price action in trading means reading raw price movement instead of relying on calculated indicators. It works because price is the source data for every technical tool. Professional traders choose it for speed, simplicity, and real time market insight.
How Price Action Analysis Works
Reading a price chart requires understanding three building blocks. These are candlestick patterns, trend structure, and key levels. Together they form the complete framework for price action in stock market analysis and every other tradable market.
Reading Candlestick Patterns
Each candlestick represents a fixed period of trading activity. The body shows the open and close. The wicks show the high and low. Together they reveal who controlled that period.
A candle with a long lower wick and small body near the top signals buyer rejection of lower prices. A candle with a large body and no wicks shows strong conviction in one direction. Learning to read these signals is the first step in price action literacy.
Identifying Trends with Highs and Lows
Trend is not a feeling. It is a measurable sequence of price points. An uptrend forms when price creates higher highs and higher lows. A downtrend forms when price creates lower highs and lower lows.
This sequence of highs and lows is the most reliable trend identification method available. It requires no calculations. Traders simply mark each swing point on the chart and observe the pattern. When the sequence breaks, the trend is changing.
Support and Resistance as Price Action Tools
Support is a price level where buyers consistently step in. Resistance is a level where sellers take control. These levels form because traders remember prices where significant activity occurred before.
The strongest levels include prior swing highs and lows, round numbers like $50 or $100, and zones where price consolidated for extended periods. When price approaches these levels, traders watch for candlestick signals to confirm a bounce or breakout.
Key Takeaway: Price action analysis relies on three building blocks. Candlesticks reveal who controls each period. The sequence of highs and lows defines the trend. Support and resistance mark the levels where the most significant reactions occur.
Core Price Action Patterns Every Trader Should Know
Four patterns form the backbone of most PA trading strategies. Each one signals a specific type of market behavior. Understanding when and where each pattern appears determines whether it produces a valid trade or a false signal.