

Technical Analysis

May 21, 2025 - 17 min

Beginner

Updated: Jul 6, 2026

What Is RSI? The Relative Strength Index Explained for Real Trading

What Is RSI? The Relative Strength Index Explained for Real Trading

The relative strength index measures whether buyers or sellers control price momentum right now. The RSI indicator gives that answer as a single number between 0 and 100. This guide covers the formula, the signals, the settings, the strategies, and the mistakes that cost traders money. Every fact is sourced and every concept is built for action.

Evgenij Pakhomov
Reviewed by:
Share

RSI at a Glance: Key Facts

QuestionAnswer
What is RSI?A momentum oscillator that measures the speed and size of recent price changes on a scale from 0 to 100.
Who created it?J. Welles Wilder Jr., a mechanical engineer, published it in 1978.
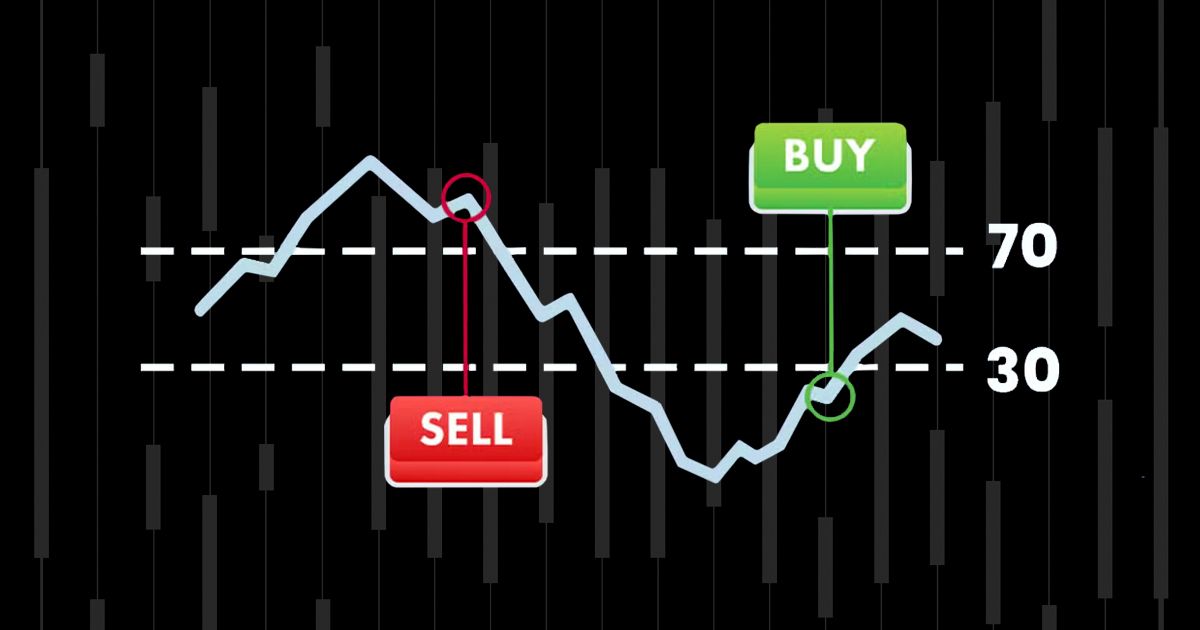
What does an RSI above 70 mean?The asset may be overbought, meaning buying pressure could be stretched too far.
What does an RSI below 30 mean?The asset may be oversold, meaning selling pressure could be exhausted.
What is the default period?14 periods, which Wilder selected to represent half of the 28 day lunar cycle.
Can RSI work on any market?Yes. Traders apply it to stocks, forex, crypto, commodities, and indices across all timeframes.

What Is the Relative Strength Index (RSI)?

The RSI is a momentum oscillator that traders use to measure how fast and how far price is moving in one direction. It produces a value between 0 and 100, and that value tells you whether recent buying or selling pressure dominates. The RSI indicator appears as a single line on a separate panel below the price chart on every major platform.

Who Created the RSI Indicator?

Welles Wilder Jr. invented the relative strength index and published it in his 1978 book "New Concepts in Technical Trading Systems". Wilder was a trained mechanical engineer and former US Navy serviceman who turned to commodity trading in the 1970s. He also created the Average True Range (ATR), the Average Directional Index (ADX), and the Parabolic SAR in the same book. Nearly five decades later, all four indicators remain built into every major charting platform.

What Does the RSI Measure?

The RSI measures momentum, not price direction. It compares the average size of recent gains to the average size of recent losses over a set number of periods. A high RSI value means gains have been larger than losses recently. A low RSI value means losses have been larger than gains. This makes the indicator useful for spotting moments when price momentum may be running out of energy.

The RSI is not the same as "relative strength" in stock screening tools. Relative strength in publications like Investor's Business Daily compares the performance of one stock to another stock or an index. The RSI indicator compares an asset only to its own recent price history.

Key Takeaway: The RSI is a momentum oscillator invented by J. Welles Wilder in 1978. It measures whether recent gains or recent losses dominate an asset's price action. It works on every market and every timeframe, and it remains one of the most widely used technical indicators nearly 50 years after its creation.

How to Calculate RSI

The RSI calculation follows a two step process. The first step produces a raw ratio called Relative Strength (RS). The second step converts that ratio into an oscillator that moves between 0 and 100. Understanding the math behind the number helps you trust the signals it produces.

The RSI Formula Step by Step

Step one calculates the Relative Strength value.

RS = Average Gain over n periods / Average Loss over n periods

Step two converts RS into the oscillator.

RSI = 100 minus (100 / (1 + RS))

For the initial calculation, you add all gains over the lookback period and divide by the number of periods to get the average gain. You do the same for losses. Periods with no gain count as zero gain. Periods with no loss count as zero loss.

After the first RSI value, Wilder applied a smoothing technique for every new bar.

Smoothed Average Gain = ((Previous Average Gain x 13) + Current Gain) / 14

Smoothed Average Loss = ((Previous Average Loss x 13) + Current Loss) / 14

This smoothing method gives more weight to recent data while still incorporating older history. It makes the RSI responsive without being erratic.

Why the Default Period Is 14

Wilder chose 14 periods because he considered it half of a 28 day natural cycle. This setting balances sensitivity and stability for most assets. Shorter periods like 7 or 9 make the RSI react faster but produce more noise. Longer periods like 21 or 28 smooth the line but delay signals.

The following table shows how the RSI reacts under a hypothetical 14 period scenario.

DayCloseChangeGainLoss
1 to 14 averageVariousVarious1.0% avg0.8% avg
RS  1.0 / 0.8 = 1.25 
RSI Step 1  100 minus (100 / 2.25) = 55.56 

An RSI of 55.56 tells you gains have been slightly larger than losses over the past 14 periods. This puts the asset in neutral territory with a mild bullish lean.

Key Takeaway: The RSI formula divides average gains by average losses and converts the result into a 0 to 100 scale. Wilder's smoothing technique makes each new bar contribute to the calculation without erasing older data. The default 14 period setting works for most markets, but traders adjust it based on their style and timeframe.

How to Read RSI Values

Reading the RSI means understanding three zones on the scale. Each zone tells you something different about buying and selling pressure. The RSI meaning changes depending on whether the broader market is trending or moving sideways.

RSI Above 70 (Overbought)

An RSI reading above 70 means recent gains have been significantly larger than recent losses. Many traders interpret this as an overbought signal, meaning upward momentum may be stretched too far. A pullback or reversal becomes more likely.

But "overbought" does not mean "sell now." In strong uptrends, the RSI can stay above 70 for days or even weeks while price keeps climbing (). Selling every time the RSI crosses 70 in a bull market leads to premature exits and missed profits.

RSI Below 30 (Oversold)

An RSI below 30 means selling pressure has dominated recent price action. Traders call this oversold, and it can signal that a bounce or reversal is approaching.

The same caution applies. In a strong downtrend, the RSI can remain below 30 for extended periods while price continues to fall. Buying oversold conditions without confirming the trend direction increases risk.

The 50 Midline and What It Signals

The 50 level on the RSI acts as a dividing line between bullish and bearish momentum. When the RSI holds above 50 during pullbacks, it suggests buyers remain in control. When it stays below 50 during rallies, sellers maintain the upper hand.

Constance Brown introduced this concept in her book "Technical Analysis for the Trading Professional." She demonstrated that in an uptrend, RSI tends to fluctuate between 40 and 90, with the 40 to 50 zone acting as support. In a downtrend, RSI tends to range between 10 and 60, with the 50 to 60 zone acting as resistance. These adjusted ranges give traders a far more accurate read than the standard 30/70 thresholds during trending markets.

Key Takeaway: RSI above 70 signals overbought conditions, and RSI below 30 signals oversold conditions. Both readings become unreliable in strong trends where the indicator can stay at extremes for extended periods. The 50 midline and Constance Brown's range rules offer a more accurate framework for reading RSI in trending markets.

RSI Settings for Different Trading Styles

There is no single best RSI setting. The right period length and threshold levels depend on your trading style, timeframe, and market volatility. Shorter periods produce faster signals with more noise. Longer periods produce cleaner signals with more lag.


Day Trading RSI Settings

Become a Confident Trader

Master trading with our structured course designed for beginners and intermediate traders.

Step-by-step lessons
Real strategies
Risk management training

Join 10,000+ traders improving their skills

Start Course Now

Day traders typically use a 10 to 14 period RSI on 5 minute to 15 minute charts. Many widen the thresholds to 80 (overbought) and 20 (oversold) to filter out false signals caused by intraday noise.

Swing Trading RSI Settings

Swing traders usually keep the default 14 period RSI on 1 hour to daily charts. The standard 70/30 thresholds work well in these timeframes because price swings tend to be larger and more defined.

Scalping RSI Settings

Scalpers prefer a very responsive 5 to 7 period RSI on 1 minute to 5 minute charts. They push thresholds to 90/10 to capture only the most extreme momentum readings.

The table below summarizes these settings.

Trading StyleRSI PeriodOverbought LevelOversold LevelBest Timeframe
Scalping5 to 790101 min to 5 min
Day Trading10 to 1480205 min to 15 min
Swing Trading1470301 hour to daily
Position Trading21 to 287030Daily to weekly

Each configuration reflects a tradeoff between speed and accuracy. Faster settings generate more entries but require tighter risk management. Slower settings produce fewer trades but offer higher confidence per signal.

Key Takeaway: Match your RSI period and thresholds to your trading style. Scalpers use fast settings with extreme thresholds. Swing traders rely on the default 14 period with 70/30 levels. No single setting works for every market or timeframe, so test your configuration on historical data before trading live.

RSI Trading Strategy: 4 Ways Traders Use RSI

The RSI indicator generates four types of actionable signals. Each approach addresses a different market condition. Combining two or more of these methods with a trend filter improves accuracy significantly.

Overbought and Oversold Reversals

This is the simplest RSI trading strategy. You watch for the RSI to cross above 70 or below 30 and then wait for it to reverse back through that threshold. The reversal back through the level acts as your entry trigger.

For example, the RSI drops to 25 and then crosses back above 30. This confirms that selling pressure has eased and buyers are stepping in. The same logic applies in reverse when the RSI drops back below 70 after an overbought reading.

This approach works best in range bound markets. In strong trends, you will get stopped out repeatedly.

RSI Divergence (Bullish and Bearish)

RSI divergence occurs when price moves in one direction while the RSI moves in the opposite direction. This mismatch signals weakening momentum behind the current trend.

Bullish divergence forms when price makes a lower low but RSI makes a higher low. This suggests selling momentum is fading and a reversal upward may follow. Bearish divergence forms when price makes a higher high but RSI makes a lower high. This warns that buying momentum is weakening.

Hidden divergence works in the opposite direction. Hidden bullish divergence appears when price makes a higher low but RSI makes a lower low, suggesting the uptrend will continue. Hidden bearish divergence appears when price makes a lower high but RSI makes a higher high, suggesting the downtrend will resume.

The table below clarifies all four patterns.

Divergence TypePrice ActionRSI ActionSignal
Regular BullishLower lowHigher lowPotential reversal upward
Regular BearishHigher highLower highPotential reversal downward
Hidden BullishHigher lowLower lowUptrend continuation
Hidden BearishLower highHigher highDowntrend continuation

Divergence alone does not guarantee a reversal. Confirm every divergence signal with a trendline break, a support or resistance level, or a secondary indicator.

RSI Failure Swings

The failure swing is a pattern that Wilder himself considered one of the strongest RSI signals. It focuses entirely on the RSI line and ignores price.

A bullish failure swing happens in four steps. The RSI falls below 30. It bounces back above 30. It pulls back but holds above the previous RSI low without crossing below 30 again. It then breaks above the intervening RSI high. This pattern confirms that bearish momentum has failed to follow through.

A bearish failure swing is the mirror image. The RSI rises above 70, pulls back below 70, rallies again but fails to reach the prior RSI high, and then drops below the intervening RSI low. This confirms that bullish momentum has stalled.

Failure swings often signal a shift in momentum before price confirms it, giving traders an earlier entry than waiting for a trendline break.

RSI Trend Line Breaks

You can draw trend lines directly on the RSI chart, just like you would on a price chart. Connect two or more RSI highs in a downtrend or two or more RSI lows in an uptrend. A break of that RSI trend line can signal a momentum shift before the price chart shows the same break.

The signal becomes stronger with more touches on the trend line. Two touches give a valid line. Three or more touches increase reliability.

This technique adds a visual layer to RSI analysis that most traders overlook. It works especially well on 1 hour and 4 hour charts where trends develop over multiple sessions.

Key Takeaway: RSI produces four types of signals. Overbought and oversold reversals work in range bound markets. Divergence warns of momentum shifts. Failure swings catch reversals early. Trend line breaks on the RSI add a visual confirmation layer. Use at least two methods together for stronger signals.

RSI vs. MACD: Which Momentum Indicator to Use

Both the RSI and the Moving Average Convergence Divergence (MACD) measure momentum, but they do it in fundamentally different ways. Understanding those differences helps you choose the right tool for each situation.

FeatureRSIMACD
TypeBounded oscillator (0 to 100)Unbounded oscillator
Best useOverbought and oversold conditionsTrend direction and momentum shifts
Signal methodThreshold crossovers (30, 50, 70)MACD line and signal line crossovers
DivergenceYesYes
Works best inRange bound marketsTrending markets
Lagging or leadingSlightly leading (momentum based)Lagging (moving average based)

The RSI tells you if momentum is stretched. The MACD tells you if the trend is accelerating or decelerating. These are complementary questions, not competing ones.

When to Combine RSI and MACD

A 2026 study by Gate.io Web3 Research found that combining MACD and RSI signals raised the backtested win rate to 77%, a significant improvement over either indicator used alone.

One practical combination is to use the RSI for entry timing and the MACD for trend confirmation. Wait for the RSI to reach oversold territory (below 30) and then look for a bullish MACD crossover before entering long. This two filter approach reduces false entries because it requires momentum exhaustion and a trend shift to align.

Key Takeaway: RSI and MACD measure different aspects of momentum. RSI identifies extremes on a bounded scale. MACD tracks trend direction through moving average relationships. Using both together filters out noise and increases win rate, as confirmed by 2026 backtesting data showing a 77% win rate for the combination.

Common RSI Mistakes and How to Avoid Them

Most traders learn the RSI in five minutes and then spend months losing money with it. The indicator itself is sound. The mistakes come from how traders interpret and apply it. This section covers the three errors that cause the most damage.

Treating RSI as a Standalone Buy or Sell Signal

Buying every time the RSI drops below 30 and selling every time it crosses above 70 is the most common mistake. Backtesting this simple approach on EURCHF over 16 months produced mostly losses. The RSI works as a confirmation tool, not a standalone trigger.

The fix is simple. Add a trend filter. Use a 200 period moving average, a higher timeframe trend analysis, or the MACD to confirm trend direction before acting on any RSI signal.

Ignoring the Trend Direction

RSI in trading behaves differently in uptrends than in downtrends. Constance Brown's research showed that RSI stays between 40 and 90 in bull markets and between 10 and 60 in bear markets. Using fixed 30/70 thresholds in a strong trend creates a constant stream of false signals.

The fix is to shift your thresholds based on the market regime. In a confirmed uptrend, treat RSI pullbacks to 40 to 50 as buying opportunities instead of waiting for 30. In a confirmed downtrend, treat RSI rallies to 50 to 60 as selling opportunities instead of waiting for 70.

Using the Same Settings for Every Market

A 14 period RSI with 70/30 thresholds works well for swing trading stocks. It does not work the same way for scalping Bitcoin on a 1 minute chart. Volatile assets like crypto produce extreme RSI readings far more often. In these markets, traders widen thresholds to 80/20 or even 90/10 to reduce noise.

The fix is to test your RSI settings on historical data for the specific asset and timeframe you trade. What works on SPY daily may fail entirely on ETH 5 minute.

Key Takeaway: The three biggest RSI mistakes are using it alone, ignoring the trend, and applying the same settings everywhere. Each mistake has a clear fix. Add a trend filter, adjust thresholds for the market regime, and backtest your settings on the specific asset you trade.

RSI Backtesting: What the Data Shows

Opinions about the RSI fill thousands of blog posts. Data is harder to find. The few publicly available backtests reveal a clear pattern. The RSI has predictive value, but only when combined with filters.

RSI Alone vs. RSI Combined with Other Indicators

QuantifiedStrategies.com backtested RSI trading strategies on stocks and stock indices over 20 years of data. A mean reversion strategy using RSI alone on the S&P 500 achieved a 91% win rate when the RSI dropped below a specific threshold and the trader bought and held for a short defined period. The key was combining the RSI with a second filter and applying it to a mean reverting asset.

The same research team tested an RSI and MACD combination strategy. The result was a 73% win rate over 235 trades with an average gain of 0.88% per trade after commissions and slippage.

A separate 2026 study by Gate.io Web3 Research tested RSI and MACD combinations in crypto markets and found a 77% win rate.

The pattern is consistent across all studies. RSI alone generates useful signals but too many false ones. RSI combined with a trend filter, a second indicator, or a market regime filter produces significantly better results.

Key Takeaway: Backtesting confirms that RSI alone generates false signals too frequently for reliable standalone use. Combining RSI with a second indicator like MACD or a trend filter raises win rates to 73% or higher. Always test any RSI strategy on historical data before committing real capital.

What You Need to Know About RSI

The Relative Strength Index is a momentum oscillator that measures the speed and size of price changes on a 0 to 100 scale. J. Welles Wilder created it in 1978, and it remains one of the most used indicators in all financial markets. RSI above 70 signals overbought conditions. RSI below 30 signals oversold conditions. The 50 midline separates bullish from bearish momentum regimes. RSI produces its strongest signals when combined with a trend filter, a second indicator like MACD, or adjusted thresholds that match the current market environment. Backtesting data confirms that RSI combined with MACD achieves win rates between 73% and 77% across stocks and crypto

Frequently Asked Questions

Disclaimer: This article is for informational purposes only and does not constitute financial advice. Trading involves risk and may result in loss of capital.

Related Articles

The First Move Is Yours

Discover how Supertrade can transform your trading career. Explore challenges, access instant funding, and join a growing community of Supertraders.

Stay Ahead of the Game

Sign up to receive exclusive tips, market insights, and the latest updates from Supertrade. Don’t miss out on opportunities to grow your trading success.
Discord

Our Community

Do not skip any beat.

The Ultimate Trading Community. Join our Discord server to get the latest updates, news and more.

2026 Supertrade. All rights reserved
DiscordInstagramTelegramYouTubeX
Trading involves significant risk. Past performance is not indicative of future results. This is a simulated trading environment. Supertrade provides educational trading services.
Supertrade
Supertrade Ltd, a company incorporated under the laws of Saint Lucia with registered number 2024-00699, located at Ground Floor, Rodney Court Building, Rodney Bay, Gros Islet, Saint Lucia, LC01 101, operates and owns this website, as well as provides services under the Terms and Conditions posted on the website. Supertrade Prop Ltd, a company incorporated under the laws of England and Wales with registered number 16234284, located at 52-56 Standard Road, London, England, NW10 6EU, acting as a payment agent.