Technical Analysis

Oct 6, 2025 - 5 min

Beginner

Updated: Apr 16, 2026

Price Action Trading: Complete Beginner’s Guide

Price Action Trading: Complete Beginner’s Guide

Understanding price action is essential for traders who want to analyze market behavior without relying on indicators.

Justin Freeman
Reviewed by:
Share

This complete guide is designed for beginner to intermediate traders who are looking to build a solid foundation in price action trading. Here, you will learn what price action trading is, why it matters for trading success, and how to apply its principles across different markets such as forex, stocks, commodities, and cryptocurrencies.

Scope:
This guide covers the fundamentals of price action trading, including its definition, core concepts, and practical strategies. You will discover how to interpret price charts, identify key support and resistance levels, recognize breakout and reversal patterns, and understand market structure. The guide also explains candlestick patterns and chart structures, providing actionable insights for both short-term and long-term trading.

Target Audience:
This article is tailored for beginner to intermediate traders who want to develop a deeper understanding of price action and improve their trading results by focusing on price movements rather than relying on complex indicators.

Why Understanding Price Action Matters:
Mastering price action trading empowers you to make informed trading decisions based on the actual movement of price, rather than lagging indicators or complicated formulas. This approach helps you anticipate market trends, spot reversals, and manage risk more effectively—key skills for trading success.

What is Price Action Trading?

Price action trading is the technique of making every decision based on a pure or 'naked' price chart. It allows traders to analyze price movements without relying on technical indicators, and one of its main advantages is its simplicity, allowing traders to focus on price rather than complex indicators. Price action trading focuses solely on price movements without relying on technical indicators.

At its core, price action trading involves studying how price moves over time and using that information to make trading decisions. The main idea is that all the information you need is already shown in the chart. Every candle, every swing high, and every swing low reflects the psychology of buyers and sellers. Understanding the sequence of highs and lows is essential for identifying trends and potential reversals in price action trading. If you know how to interpret these moves, you can anticipate where the market may go. This approach focuses only on raw data and doesn’t rely on multiple indicators; this is why it is called a “clean way” of trading.

You can work with price action across all the markets, such as forex, stocks, commodities, and even cryptocurrencies. The principle remains the same for short-term and long-term trades. This is one of the main reasons why the majority of traders use price action. Price action trading can be considered a part of technical analysis, but it is highly complex compared to most forms of technical analysis.

Price action is highly adaptable. If you understand how to use price action, you can develop strategies for all types of market moves: breakouts, reversals, and trend conditions. You can also detect key support and resistance levels, which are, in most cases, decision points in the market.

It’s important to note that price action trading requires skill and experience to interpret price movements effectively, which can be challenging for beginners. The interpretation of price action can be subjective, so different traders may reach different conclusions based on the same price movements.

Here, we will have a look at how price action trading works, and check how to use it for your strategy. You will also learn how to understand support and resistance levels and what role they play. When analyzing price action, traders primarily use candlestick charts as a visual tool to display high, low, open, and close prices. The market's price chart reflects all price-moving events, making it the foundation for price action analysis.

Next, let's explore how price action strategies are applied in breakout and reversal trading.

Candlestick Patterns and Price Action Techniques

To understand price action, you need to study patterns such as candlestick formations, chart structures, and momentum shifts. For example, a pin bar candle at a resistance level may signal a potential reversal, while a strong bullish candle that breaks past resistance might indicate the start of a new uptrend. Based on this, you can place trades. Price action analysis is a core methodology for making trading decisions, as it focuses solely on price movements without relying on technical indicators.

Price trading is different from lagging indicators, such as moving averages or oscillators. It gives you direct insight into what is happening now. This is why you can use it regardless of whether you are a short-term or long-term trader. If you are a scalper, you can use it to catch quick moves, and if you are a swing trader, you can rely on it to enter positions in longer market trends, while tools like the MACD trading indicator guide can be used as secondary confirmation.

Versatility is another benefit of this approach. You can use it for different markets, such as forex, stocks, and crypto. Price action is based on human behavior, and this is why it works everywhere. Even if assets are different, the market psychology stays the same. Buyers and sellers follow the same patterns, and you can analyse these patterns and make decisions based on them. Exploring what price action is and top patterns can give you a structured overview of these setups. Price action strategies and price action techniques can be adapted to different markets and trading styles, making them useful for a wide range of traders.

You won’t learn to read price action trading very rapidly. You will need patience, practice, and some time. But once you learn it, you will be able to trade with more confidence and less confusion. This is why we recommend that you take a special course on price action trading if you want to build strong trading skills, and understanding how long it takes to learn trading can help you set realistic expectations and stay consistent. Skill and experience are essential for interpreting price action accurately, and interpreting price action is subjective—different traders may see the same price movements differently.

When analyzing patterns, traders often analyze price action by examining candlestick patterns, chart setups, and specific price action techniques such as the Ross Hook pattern to improve their trading.

Price action trading can also be combined with other methods, such as fundamental analysis or technical indicators, to create a more comprehensive trading strategy, and many traders use the best indicators for TradingView to complement their price-focused approach.

Breakout and Reversal Price Action Trading

Two of the most common strategies within price action trading are breakout trading and reversal trading. To use these approaches, you observe how the market reacts at important price levels and place trades based on that behaviour.

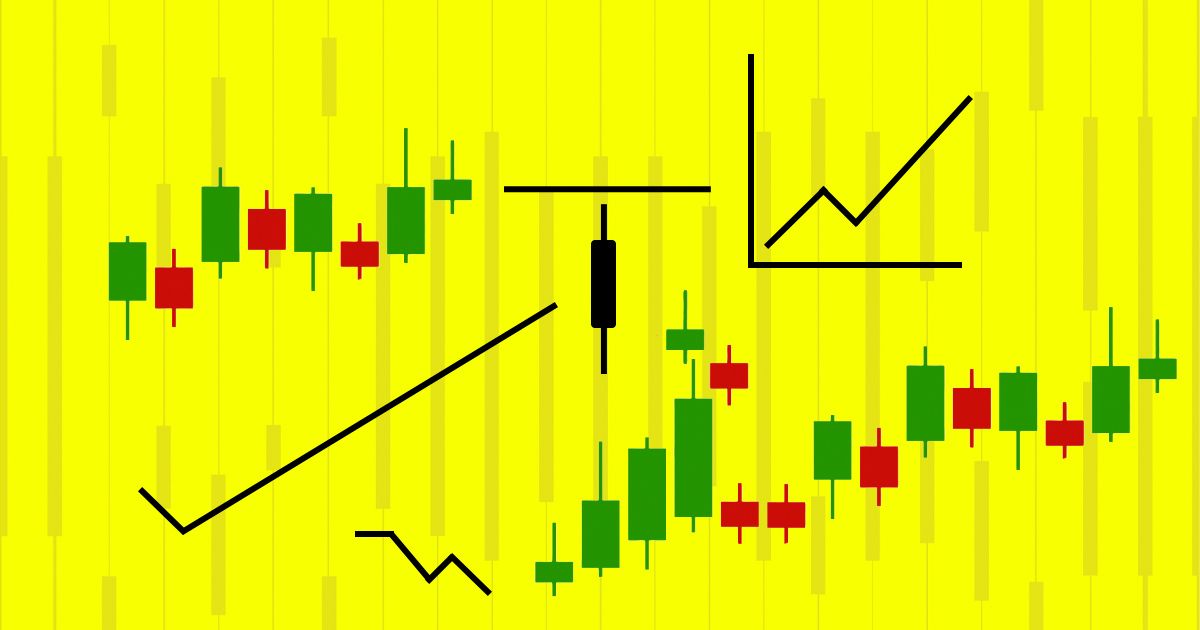
When the price crosses the level of support or resistance, a breakout may occur. For example, if a stock has been stuck under $100 for weeks and suddenly breaks above that level with strong momentum, this is considered a breakout. You can consider it as the start of a new trend. Traders often wait for confirmation that the trend resumes after a breakout or pullback before entering a position. You can enter positions in the direction of the move and expect that the momentum will continue. If you know price action trading, you can spot these breakouts easier.

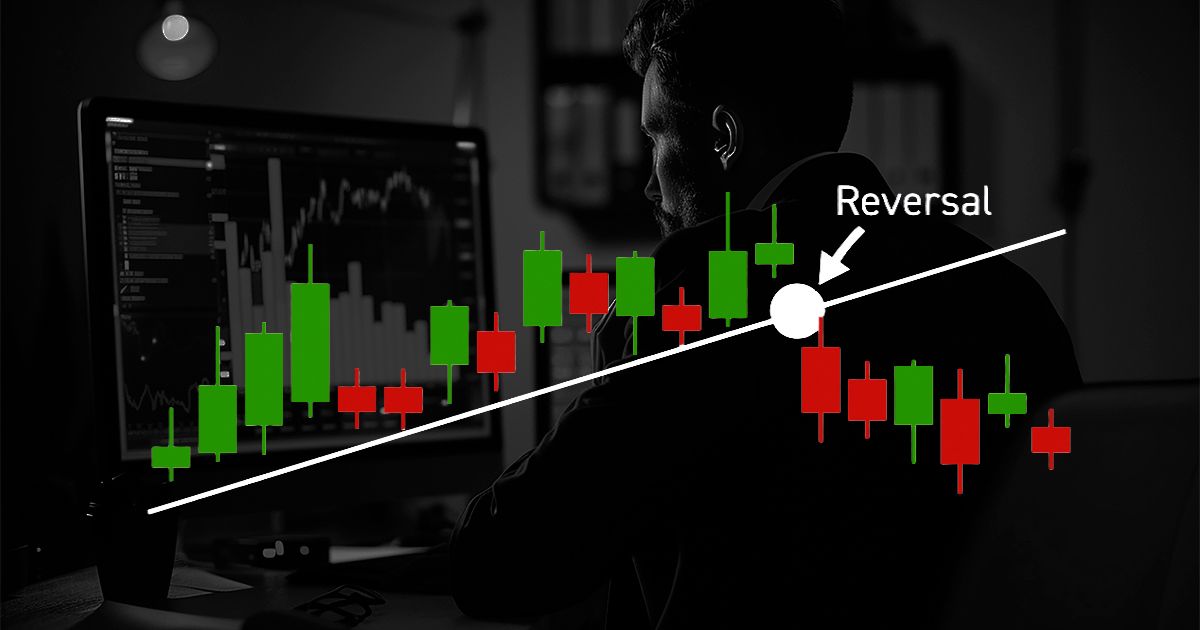
When the market changes its direction, you can expect a reversal. For example, if you see that the price has grown for a while but then it forms a double top or a bearish candlestick pattern, it means that a downward reversal may come. Similarly, if you see that after a strong downtrend, there are bullish signals, it may indicate a reversal upward. In these scenarios, look for signs of exhaustion in one direction and prepare to trade the opposite way. Traders also monitor swing highs and swing lows to identify the direction of the trend and potential reversal points.

Both strategies require discipline. Not every breakout leads to a long trend, and not every reversal holds. That is why you shall wait for confirmation, such as a retest of the breakout level or strong candlestick patterns. Price action traders often wait for confirmation signals, such as an inside bar or price breaks above or below a prior bar, before entering trades to avoid false breakouts or reversals.

Become a Confident Trader

Master trading with our structured course designed for beginners and intermediate traders.

Step-by-step lessons
Real strategies
Risk management training

Join 10,000+ traders improving their skills

Start Course Now

If you master breakout and reversal trading, you will be able to take advantage of both trending and turning markets. These strategies are the main components of price action trading, and this is why you shall learn them to become more successful. Continuation patterns occur during a trend and indicate that the market is likely to move in the same direction, so traders look for common price action patterns to gauge market sentiment and potential future price movements.

Analyzing the size and formation of candlesticks can also help improve your market entries.

Next, let's take a closer look at reversal trading and how to identify key reversal signals.

What is Reversal Trading?

If you want to learn reversal trading, you shall learn reversal trading first. A reversal simply means that the market changes its direction. Instead of continuing to move up, it starts going down, or vice versa. If you learn to spot reversals early, you will be able to catch big moves with excellent profit potential.

So, what exactly is reversal trading?

It is about identifying signals that suggest the current trend gets weaker and an opposite direction may soon begin. You may use a lot of tools to spot those signals. For example, you can use candlestick patterns such as:

  • Engulfing candle
  • Hammer
  • Shooting star
  • Pin bar (with its long wick and a significant difference between the opening price and the close, often indicating price rejection and potential reversals, especially when it forms at psychological levels or near support and resistance)

Chart structures like the double top, double bottom, or head and shoulders pattern also give strong reversal clues.

Reversal trading is not about guessing. When you see signals of a reversal, wait for confirmations. For example, if you see that a market is in a strong uptrend, don’t assume it will reverse just because the price looks high. Wait for price action signals at key levels, such as resistance zones or psychological price points, as these psychological levels can strongly influence trader behavior and trigger reversals. Only when you see that a clear pattern forms and is confirmed by the next few candles, place a trade. Sudden price drops or a price hit at a support or resistance level can also provide important clues that a reversal may be underway.

Reversal trading may also look attractive to you because it often offers excellent risk-to-reward ratios. You enter a position near the end of one trend and the start of another; this is why the potential move can be large compared to the risk. When trading chart patterns like the head and shoulders, you can set a profit target by measuring the distance from the head to the neckline to estimate the potential price move after a breakout. However, false signals are common; this is why you shall be patient and disciplined. Effective risk management is essential—always place stop-loss orders near key support or resistance levels to manage risk and protect your capital, and learning what stop loss is in trading will help you apply this protection correctly.

Using candlestick patterns and price action signals can also help you decide when to exit trades, especially when you spot signs of a trend reversal.

Now that you understand reversal trading, let's move on to another crucial aspect of price action: trading support and resistance.

Trading Support and Resistance

Support and resistance are other details to consider if you are into price action trading. These are the key levels where the market tends to pause, bounce, or reverse. They represent areas where there is a strong buying or selling pressure; this is why you should know how to identify them if you want to trade profitably. Resistance lines, in particular, serve as horizontal barriers where price may reverse or consolidate, helping traders identify key market turning points and trade opportunities.

What is Support?

Support is a level where the price stops falling and bounces back up. It acts like a floor in the market. For example:

  • If a stock repeatedly drops to $50 and then rises again, that level is considered support. You can see it as an area where buyers step in.

What is Resistance?

Resistance, on the other hand, is the opposite. It can be compared to a ceiling where the price struggles to rise above. For example:

  • If the same stock hits $100 several times but fails to break through, that is resistance. Sellers dominate at this level and push the price back down.

The market's price movement at these levels reflects all variables influencing the market, encapsulating the beliefs and actions of all participants.

Using Support and Resistance in Trading

You can use these levels in many ways. For example, you can trade the bounce, where you buy at support and sell at resistance. You can also trade breakouts, where the price finally breaks above resistance or below support, which leads to strong momentum in the new direction. Volume confirmation adds credibility to a breakout or support level; high volume indicates strong momentum while low volume suggests a false signal. Concepts from auction market theory and how price moves can further deepen your understanding of how buyer and seller activity shapes these levels.

Support and resistance levels also provide valuable context for other strategies. For example, a reversal pattern near resistance carries more weight than the same pattern in the middle of nowhere. Similarly, breakouts are more powerful when they occur at well-established levels. During trading ranges, periods of low range—where price movement is minimal—can precede significant moves, and market pulls (pullbacks) during trends can signal potential trend resumption or reversal.

If you know how to determine the support and resistance levels, you can create a clear framework for your trades. Combine resistance and support trading with candlestick patterns and other price action signals, and you will boost your profitability. Traders should focus on price action setups or patterns from confluent levels in the market, and there are various trading methods available to analyze these scenarios and improve decision-making.

With a solid understanding of support and resistance, let's now examine how market structure ties all these concepts together for effective price action trading.

Market Structure

Understanding market structure is at the heart of successful price action trading. Market structure refers to the way a financial market is organized and how price movements unfold over time, shaped by the actions and reactions of market participants. For price action traders, analyzing market structure means looking beyond individual candlestick patterns and focusing on the bigger picture—how price behaves at key levels, how trends develop, and where the market is likely to turn or accelerate.

A core part of market structure analysis is identifying support and resistance levels. These are the key areas on a price chart where buying or selling pressure has previously caused the market to pause, reverse, or break out. By marking these levels, price action traders can anticipate where future price movements might stall or gain momentum, allowing them to plan their trades with greater precision.

Trending markets are another crucial aspect of market structure. In a trending market, price moves consistently in one direction—either upward in a bull market or downward in a bear market. Recognizing the prevailing trend helps traders align their price action trading strategies with the market’s momentum, increasing the probability of successful trades. For example, in an upward trend, experienced traders look for opportunities to buy on pullbacks to support levels, while in a downward trend, they may seek to sell at resistance.

However, not all markets trend all the time. There are periods of consolidation, where price moves within a narrow range and the market structure becomes less directional. These trading ranges often signal indecision among market participants and can precede significant breakouts. By studying these areas of congestion, price action traders gain insights into market sentiment and can prepare for potential future price movements when the range eventually resolves.

While many traders use technical indicators like moving averages or RSI to confirm their trading decisions, most price action traders rely primarily on the price chart itself. They interpret market structure by analyzing swing highs and lows, trend lines, and candlestick patterns, rather than depending on lagging indicators. This approach allows them to react more quickly to changes in market direction and to base their trading strategies on the most current price data.

It’s important to remember that market structure is not static. As new information enters the market—such as economic data releases or shifts in market sentiment—price action reflects these changes, and the structure evolves. Successful price action traders continuously monitor the market’s price chart, adapt their strategies, and remain flexible in their trading decisions.

In summary, mastering market structure is essential for anyone serious about price action trading. By understanding how price moves, where key levels of support and resistance lie, and how trends and consolidations form, traders can develop robust price action trading strategies. Traders who gain these skills can then look for ways to apply them in real capital environments, for example a prop trading education platform like Super Academy or funded trading programs with flexible plans. This deeper insight into market behavior helps traders make more informed decisions, manage risk effectively, and ultimately improve their trading performance in all types of market conditions.

Frequently Asked Questions

Disclaimer: This article is for informational purposes only and does not constitute financial advice. Trading involves risk and may result in loss of capital.

Related Articles

The First Move Is Yours

Discover how Supertrade can transform your trading career. Explore challenges, access instant funding, and join a growing community of Supertraders.

Stay Ahead of the Game

Sign up to receive exclusive tips, market insights, and the latest updates from Supertrade. Don’t miss out on opportunities to grow your trading success.
how it works

Our Community

Do not skip any beat.

The Ultimate Trading Community. Join our Discord server to get the latest updates, news and more.

2026 Supertrade. All rights reserved
DiscordFacebookInstagramTelegramYouTubeXTikTok
Trading involves significant risk. Past performance is not indicative of future results. This is a simulated trading environment. Supertrade provides educational trading services.
Supertrade
Supertrade Ltd, a company incorporated under the laws of Saint Lucia with registered number 2024-00699, located at Ground Floor, Rodney Court Building, Rodney Bay, Gros Islet, Saint Lucia, LC01 101, operates and owns this website, as well as provides services under the Terms and Conditions posted on the website. Supertrade Prop Ltd, a company incorporated under the laws of England and Wales with registered number 16234284, located at 52-56 Standard Road, London, England, NW10 6EU, acting as a payment agent.