
Bull and Bear Market at a Glance
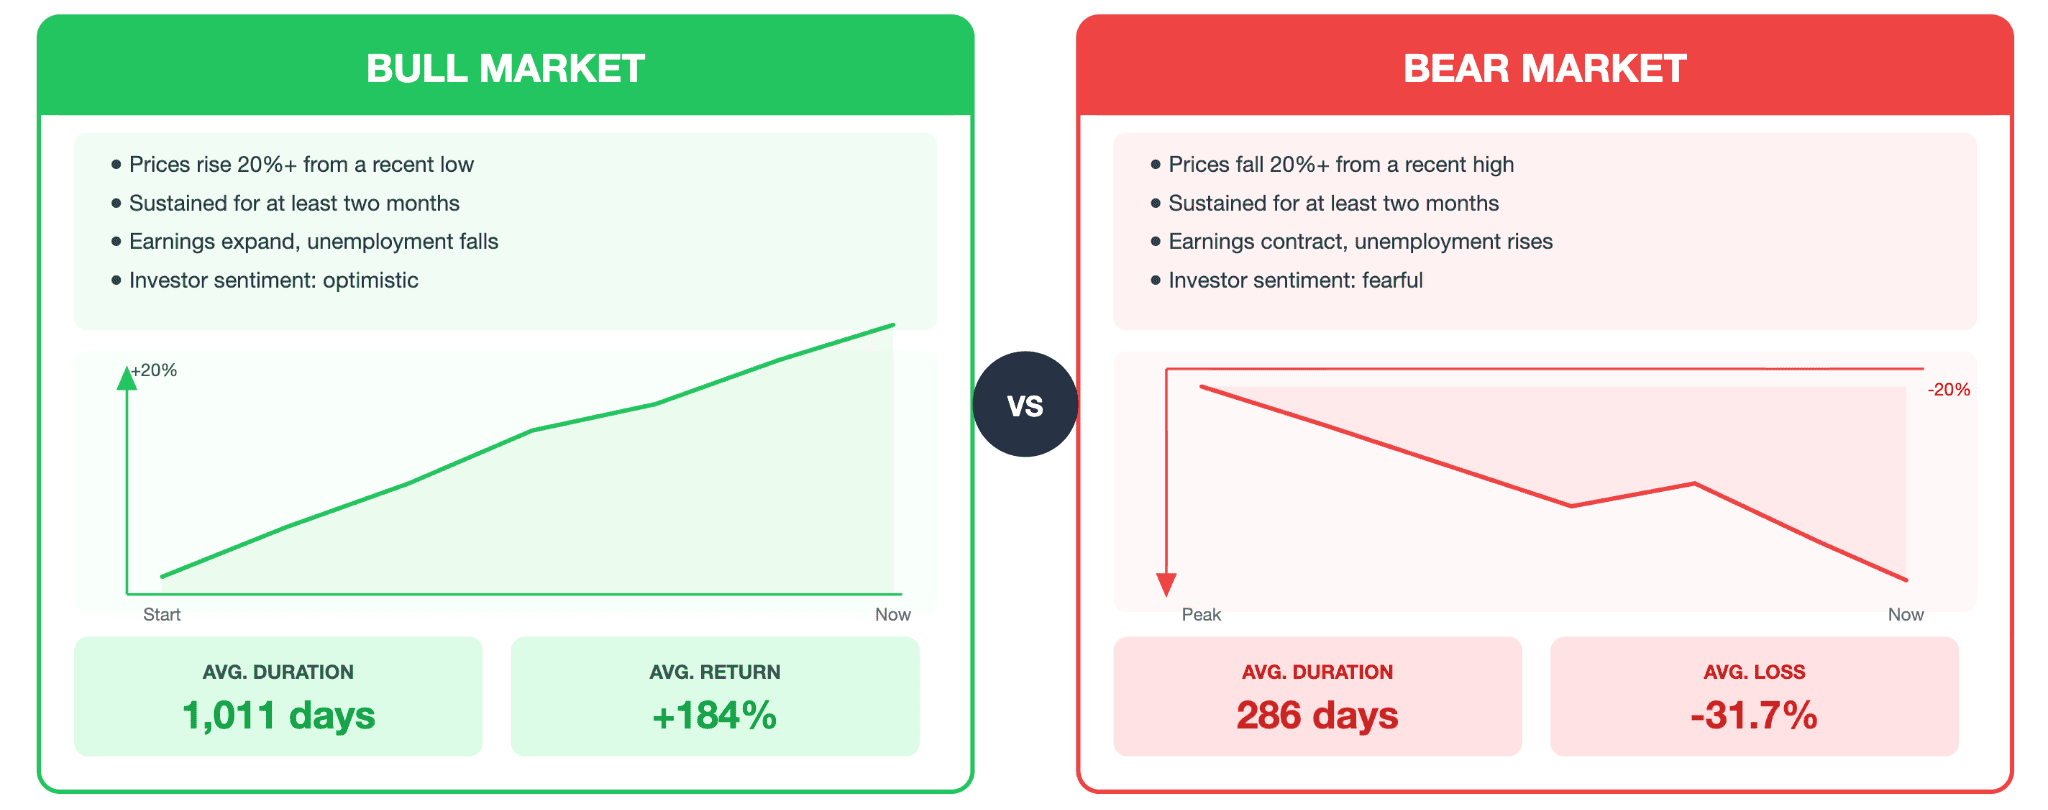
- Bull market: 20% gain from recent low
- Bear market: 20% drop from recent high
- Average bull lasts 1,011 days historically
- Average bear lasts 286 days historically
- S&P 500 averages one correction per year
- Bears cover 38% of all market time
- 1 in 4 corrections turns into bear
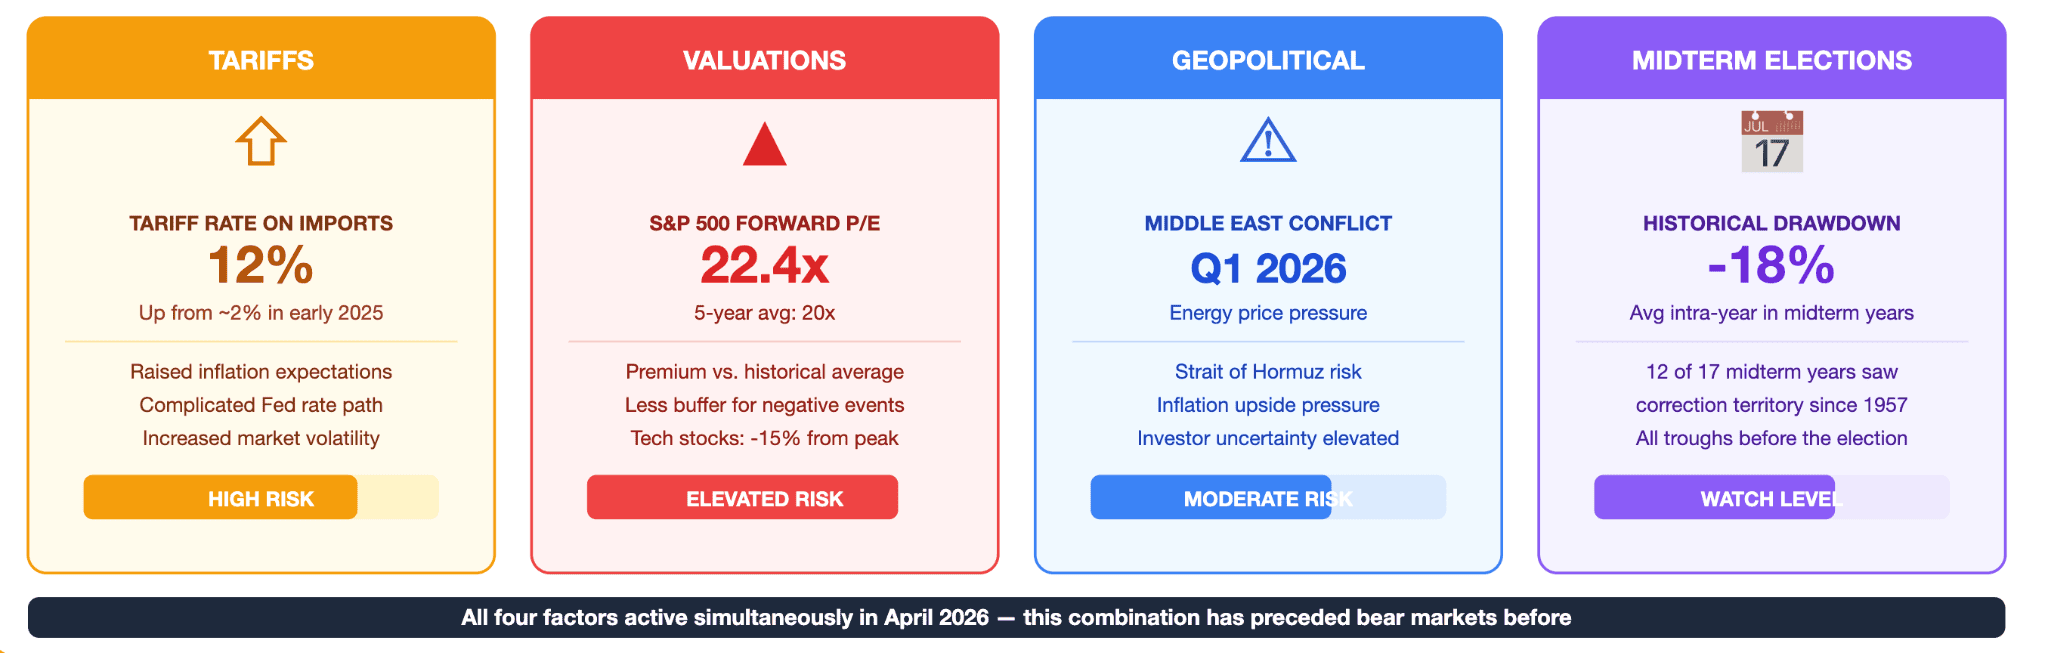
- Midterm years average 18% intra-year drawdown
What Is the Bull and Bear Market Definition?
The terms bull and bear describe the direction of prices over a sustained period. They are not about a single day or a single event. Each phase carries distinct economic conditions, distinct investor behaviour, and a distinct set of trading rules.
What Is a Bull Market in 2026: Real Numbers Talk
A bull market starts when a major stock market index climbs 20% or more from its recent low. That gain must hold for at least two months to qualify. The current S&P 500 bull market started in October 2022. Since that low, the index has returned 92% through early 2026.
Bull markets do not move in a straight line. Pullbacks and corrections happen inside them. What defines the phase is the overall direction. Prices make higher highs over time. Corporate earnings expand, unemployment stays low, and investor sentiment stays net positive. The 2009 to 2020 bull run lasted nearly 4,000 days and survived multiple corrections along the way.
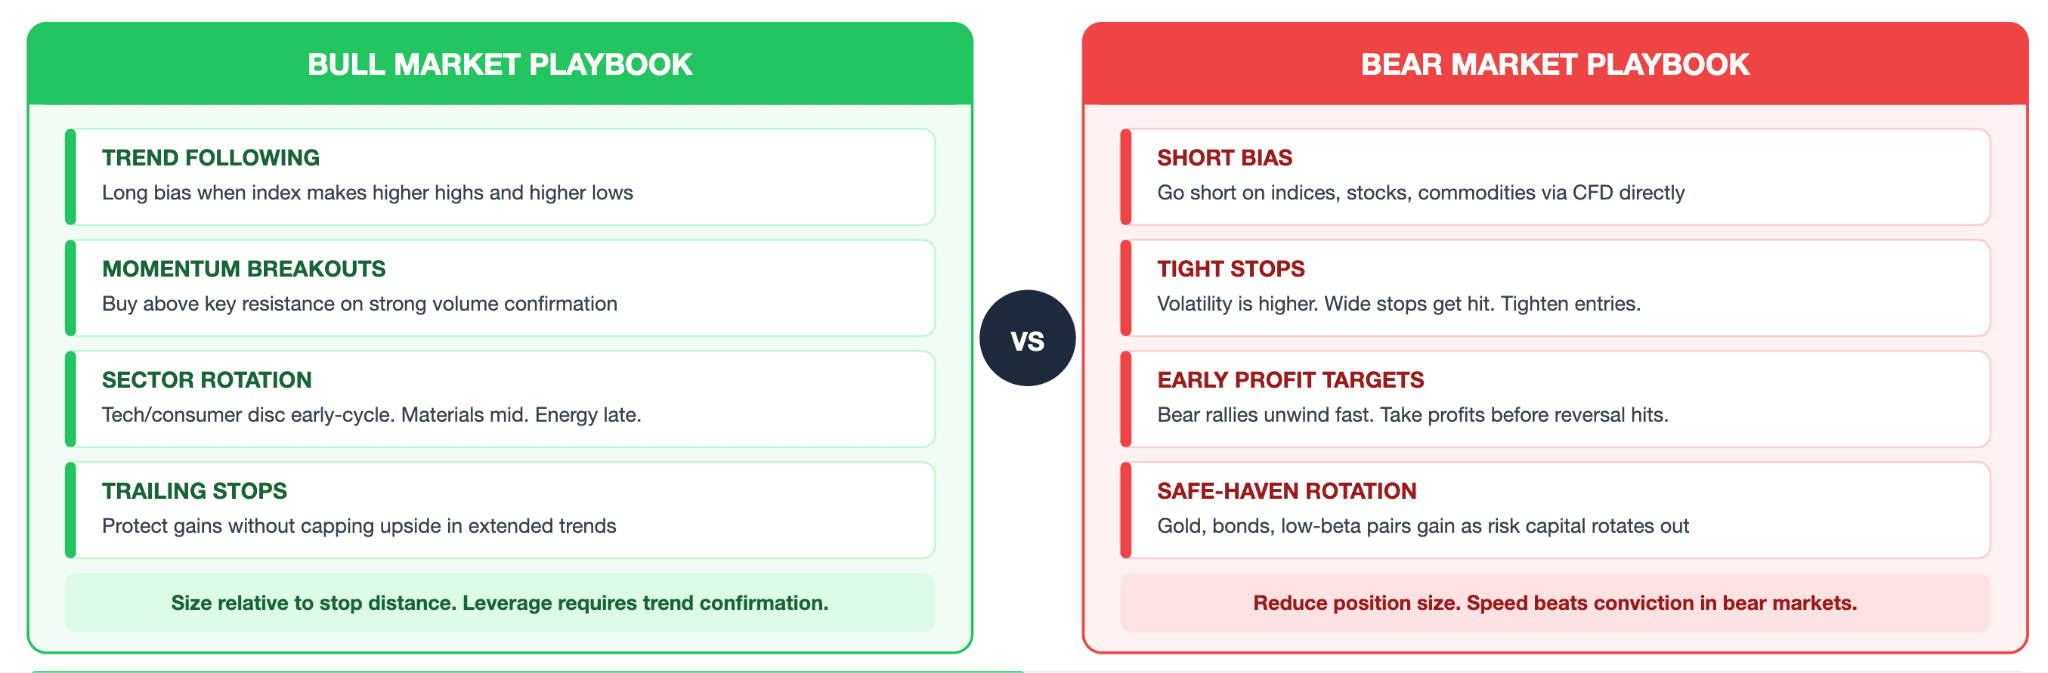
"A bull market does not mean every stock is going up. It means the tape is pulling in your favour. Your job is to stay aligned with that pull and not fight it."
What Is a Bear Market: The Starting Point
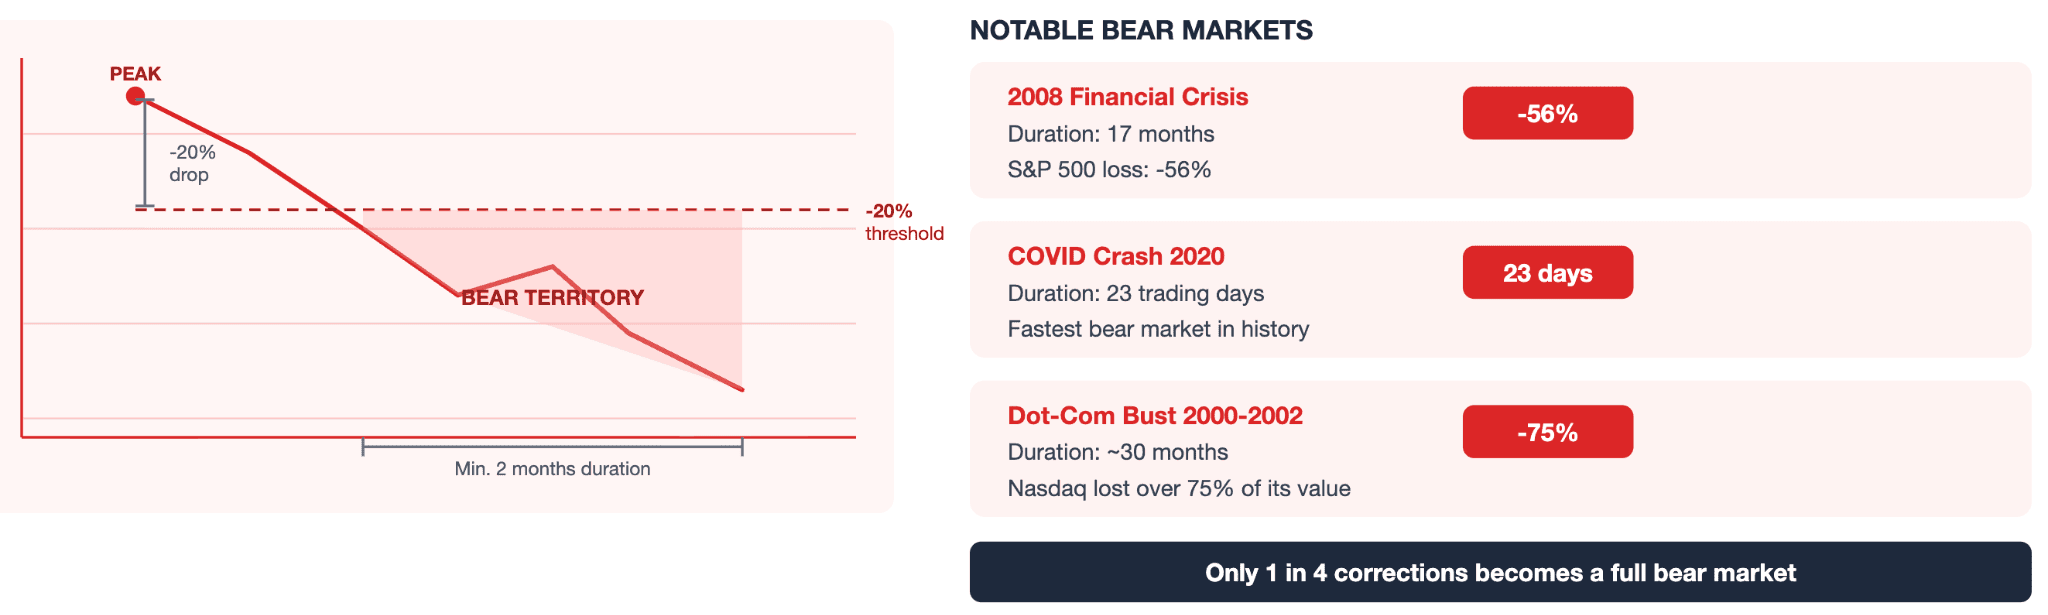
A bear market begins when a major index falls 20% or more from its recent high. That decline must persist for at least two months. Price drops below that threshold are corrections. Only about one in four corrections deepens into bear territory.
Bear markets run shorter than bull markets on average, but they feel longer. Prices fall faster than they rise. Volatility spikes and news flow turns persistently negative. The 2008 bear lasted 17 months and wiped roughly 56% off the S&P 500. The COVID crash of 2020 reached bear territory in just 23 trading days.
Key takeaway: Bull and bear markets are defined phases with specific thresholds and minimum durations. Everything between those thresholds is a correction.
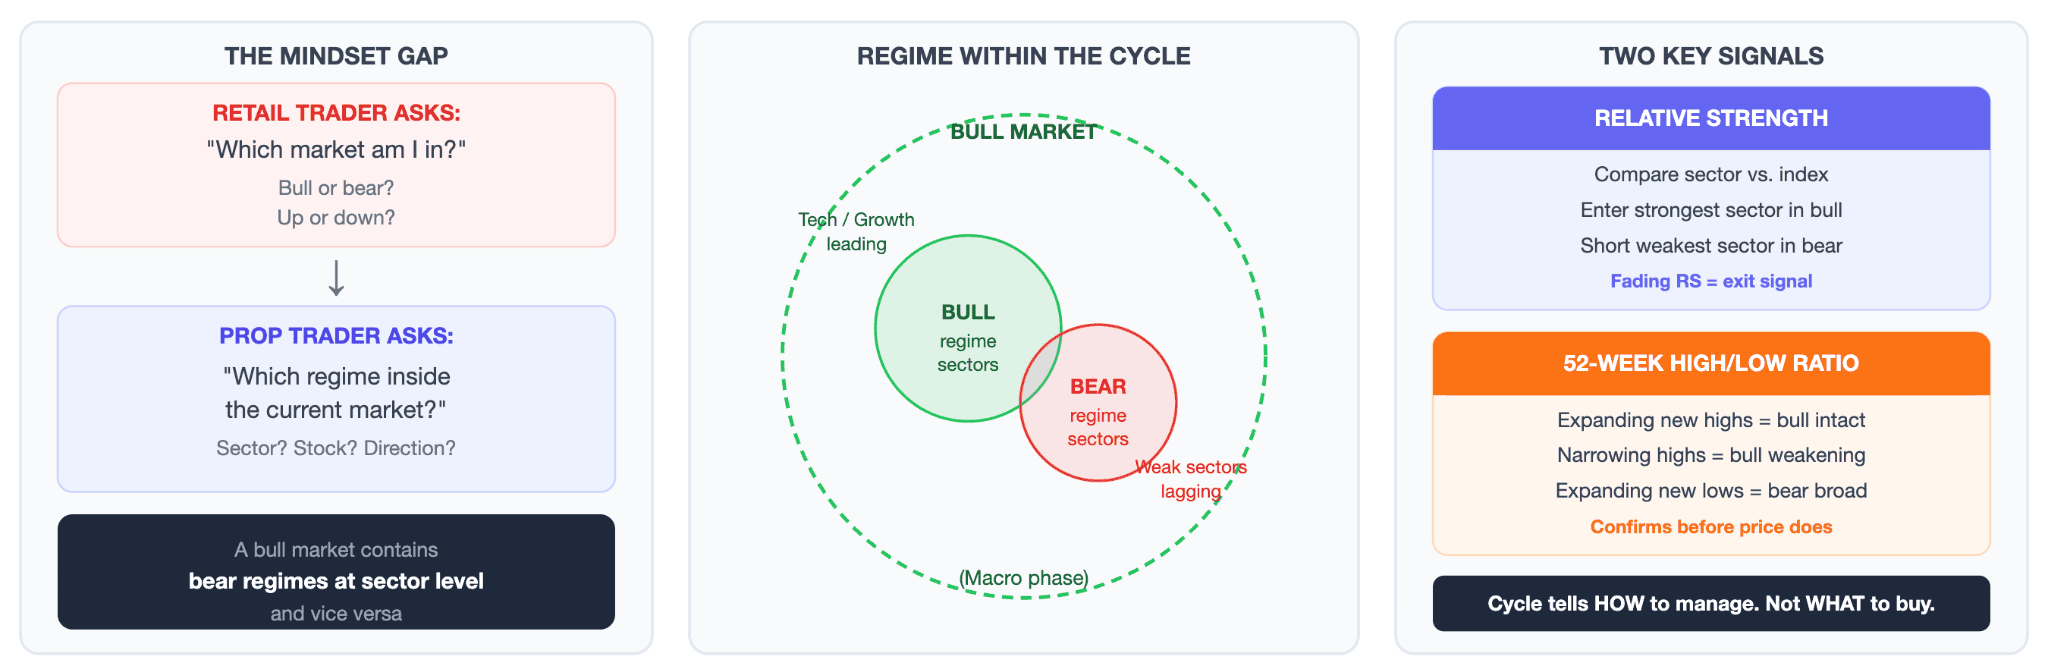
What Is the Difference Between a Bear and Bull Market?
Direction is the obvious answer. But traders who stop at the direction miss more important differences. How long each phase lasts, how much ground it covers, and what drives the people inside it all matter. Those mechanics shape everything from entry timing to stop placement.
How Do Price Thresholds and Duration Compare?
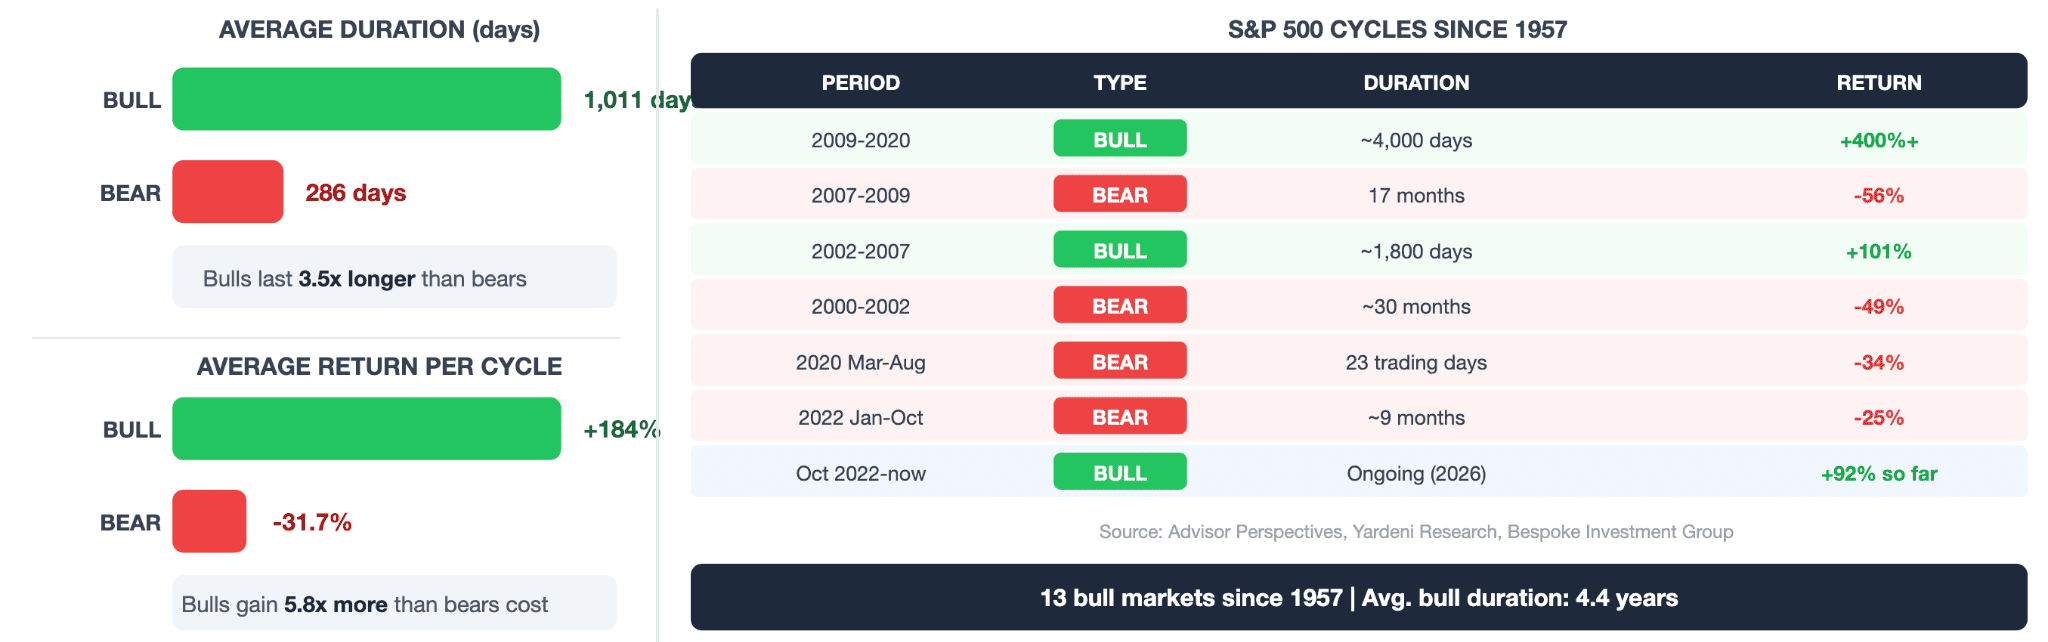
A bull market clears 20% from a recent low. A bear market crosses 20% down from a recent high. Since 1957, the S&P 500 has recorded 13 bull markets averaging 4.4 years each. Bear markets over the same period averaged under one year.
The return gap tells the bigger story. Past S&P 500 bull markets have delivered an average gain of 184% per cycle according to Yardeni Research. Average bear market losses sit around 31.7%. Secular bull years outnumber secular bear years 92 to 57 since 1871. That asymmetry explains why long-term equity exposure produces positive returns despite periodic crashes.
How Does Investor Sentiment Differ?
In a bull market, rising prices attract more buyers. More buyers push prices higher. That cycle feeds itself until valuations stretch too far or economic conditions shift. Greed dominates. Risk appetite expands. Traders take larger positions with more leverage.
Bear markets run on a different fuel entirely. Margin calls force liquidations at any price. Credit tightens and reduces the pool of available buyers. News gets interpreted negatively regardless of the underlying data. The index stops reflecting economic conditions and starts driving them.
| Factor | Bull Market | Bear Market |
| Price direction | Rising 20%+ from lows | Falling 20%+ from highs |
| Average duration | 1,011 days | 286 days |
| Average S&P 500 return | +184% per cycle | -31.7% per cycle |
| Volatility pattern | Lower, trending | Higher, erratic |
| Dominant emotion | Greed | Fear |
| Economic backdrop | Growth, low unemployment | Contraction, rising unemployment |
The S&P 500 nearly entered bear territory in April 2025 on tariff shock. It recovered to finish the year up 16%. Phase labels describe direction over time, not any single moment.
Key takeaway: Bull markets last longer and deliver more than bear markets take away. Bear markets move faster, hit harder, and punish the unprepared. The difference between a correction and a bear market is not just 10 percentage points.