TradingView is one of the most popular charting platforms in the world, and for good reason. With an intuitive interface, access to thousands of assets, and a massive library of technical indicators, it offers something for traders of all levels. But with so many tools available, it can be overwhelming to know which indicators actually matter.
Whether you’re a beginner learning the ropes or an experienced trader refining your edge, this guide will walk you through 10 of the best indicators on TradingView that can genuinely enhance your analysis and decision-making.
1. Relative Strength Index (RSI)
The RSI is a classic momentum oscillator that measures the speed and change of price movements. It ranges from 0 to 100 and helps identify overbought and oversold conditions.
- Above 70 = overbought (possible pullback)
- Below 30 = oversold (possible bounce)
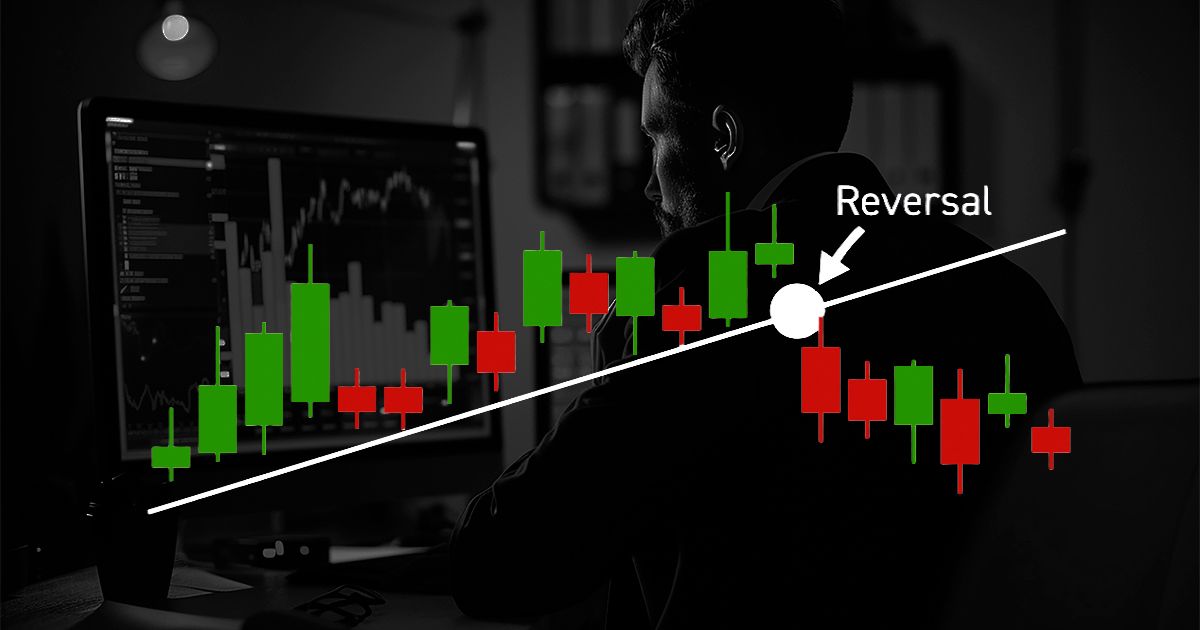
Why it’s useful: RSI can help traders spot trend reversals or confirm trend strength when used alongside price action. Best for: Spotting divergences, trend continuation, and potential reversal zones.
2. Moving Average Convergence Divergence (MACD)
The MACD is both a trend-following and momentum indicator. It shows the relationship between two moving averages (usually the 12 and 26 EMA) and includes a signal line and histogram.
Key signals:
- MACD crosses above signal line = potential buy
- MACD crosses below signal line = potential sell
Why it’s useful: It helps confirm trends and spot momentum shifts early. Best for: Momentum trading and trend confirmation.
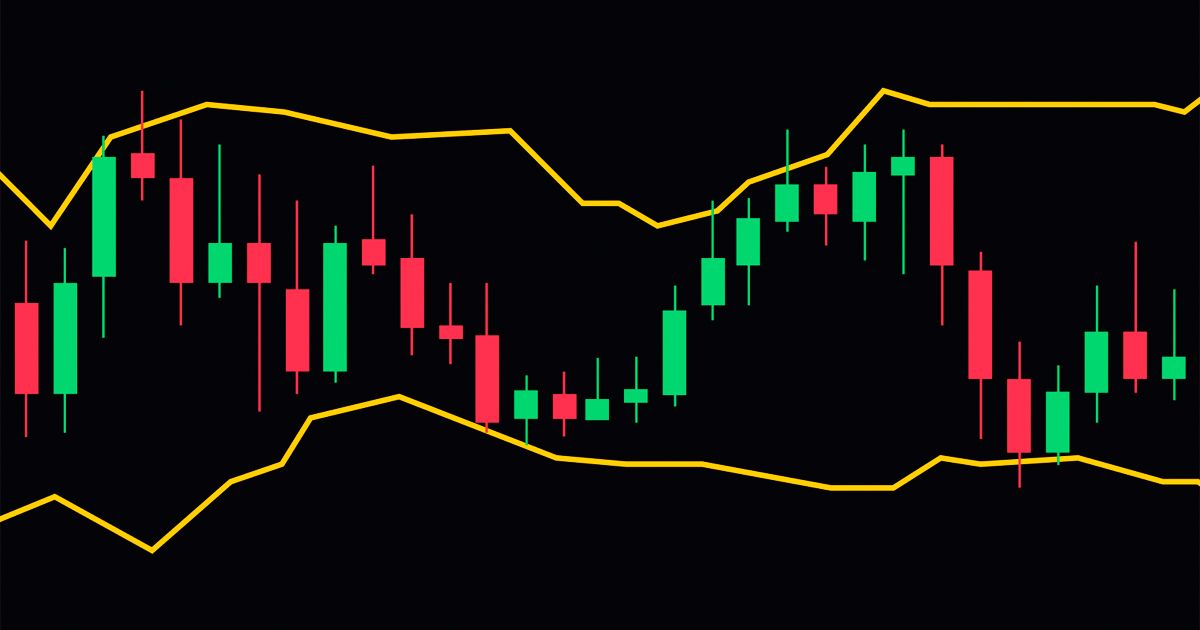
3. Volume Profile Fixed Range
This powerful indicator displays the volume traded at each price level over a selected range, giving you a visual of support/resistance zones that actually matter.
Why it’s useful: It shows where buyers and sellers are most active, and helps identify high-probability areas for entries, exits, and stop placements. Best for: Volume-based analysis, especially in range-bound or consolidation markets.
4. Exponential Moving Averages (EMA)
EMAs are weighted moving averages that give more importance to recent prices. Common setups include the 8, 21, 50, and 200 EMA.
Why it’s useful: EMAs are great help to identify dynamic support and resistance, as well as trend direction. Popular combination: Use 8 and 21 EMA crossovers for short-term signals or the 50/200 EMA crossover (Golden Cross or Death Cross) for longer-term insights. Best for: Trend identification and entry timing.
5. Supertrend
The Supertrend indicator plots a line above or below price based on volatility (ATR) and trend direction.
- Green line = uptrend
- Red line = downtrend
Why it’s useful: It’s simple, visual, and helps filter trades in the direction of the prevailing trend. Best for: Trend trading and quick direction filters.