Fundamental Analysis

May 22, 2026 - 13 min

Beginner

Fundamental Trading: What It Is, How It Works, and How to Use It in 2026

fundamental analysis guide

Most traders who fail their prop challenge lose not because of a bad strategy. They lose because they ignore what moves the market that day. Fundamental trading gives you that context. This guide answers how to run the analysis, which indicators matter most, and how to apply them across markets.

Justin Freeman
Reviewed by:
Share

Fundamental Analysis at a Glance: Key Facts Every Trader Should Know

Before reading further, here are the numbers that define why this approach matters:

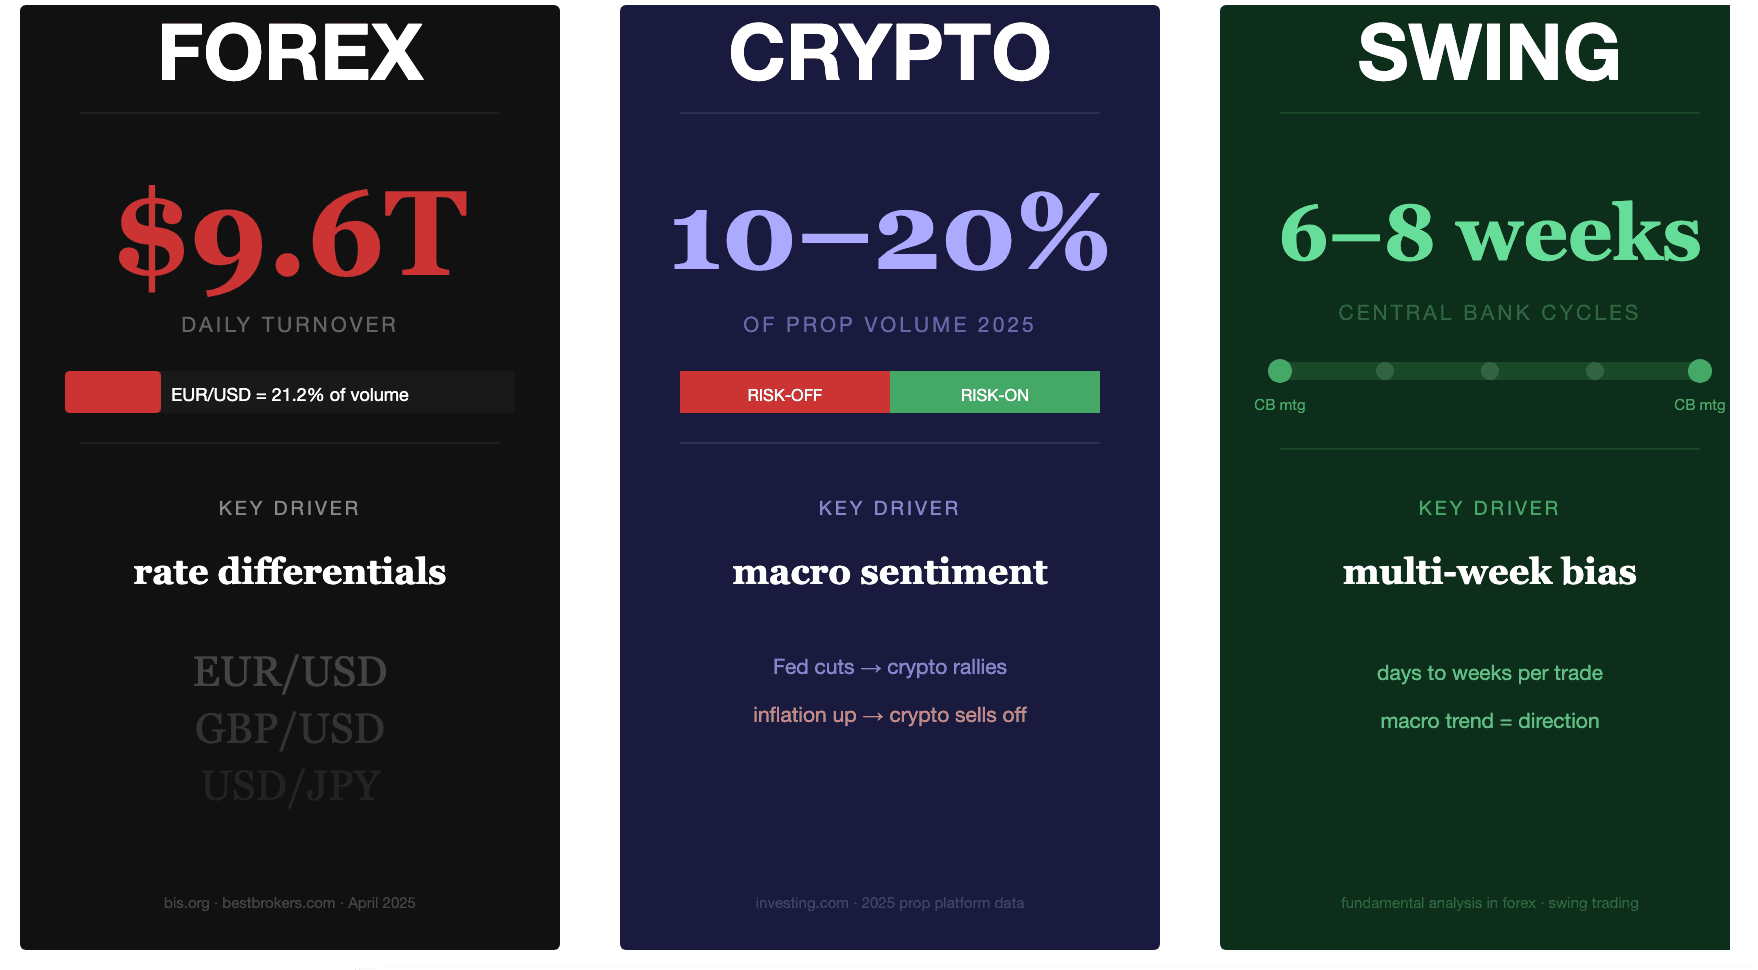
  • Forex daily turnover reached $9.6 trillion in April 2025 
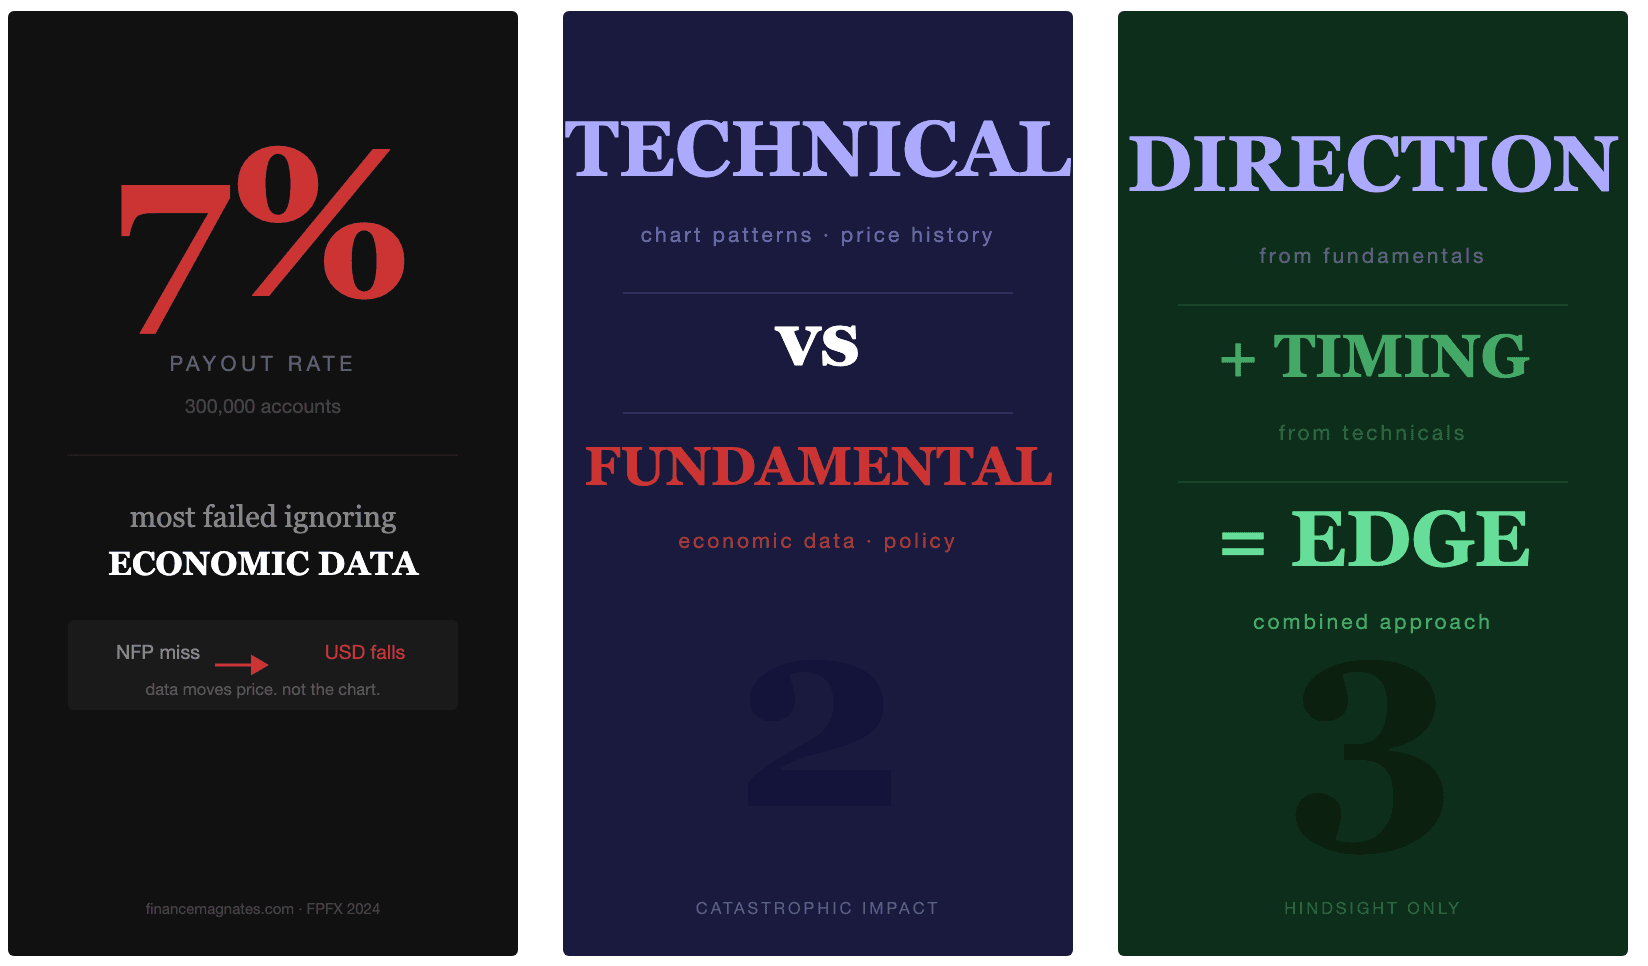
  • Only 7% of 300,000 prop trading accounts achieved payouts
  • US Core CPI stood at 2.5% in February 2026, driving Fed rate expectations
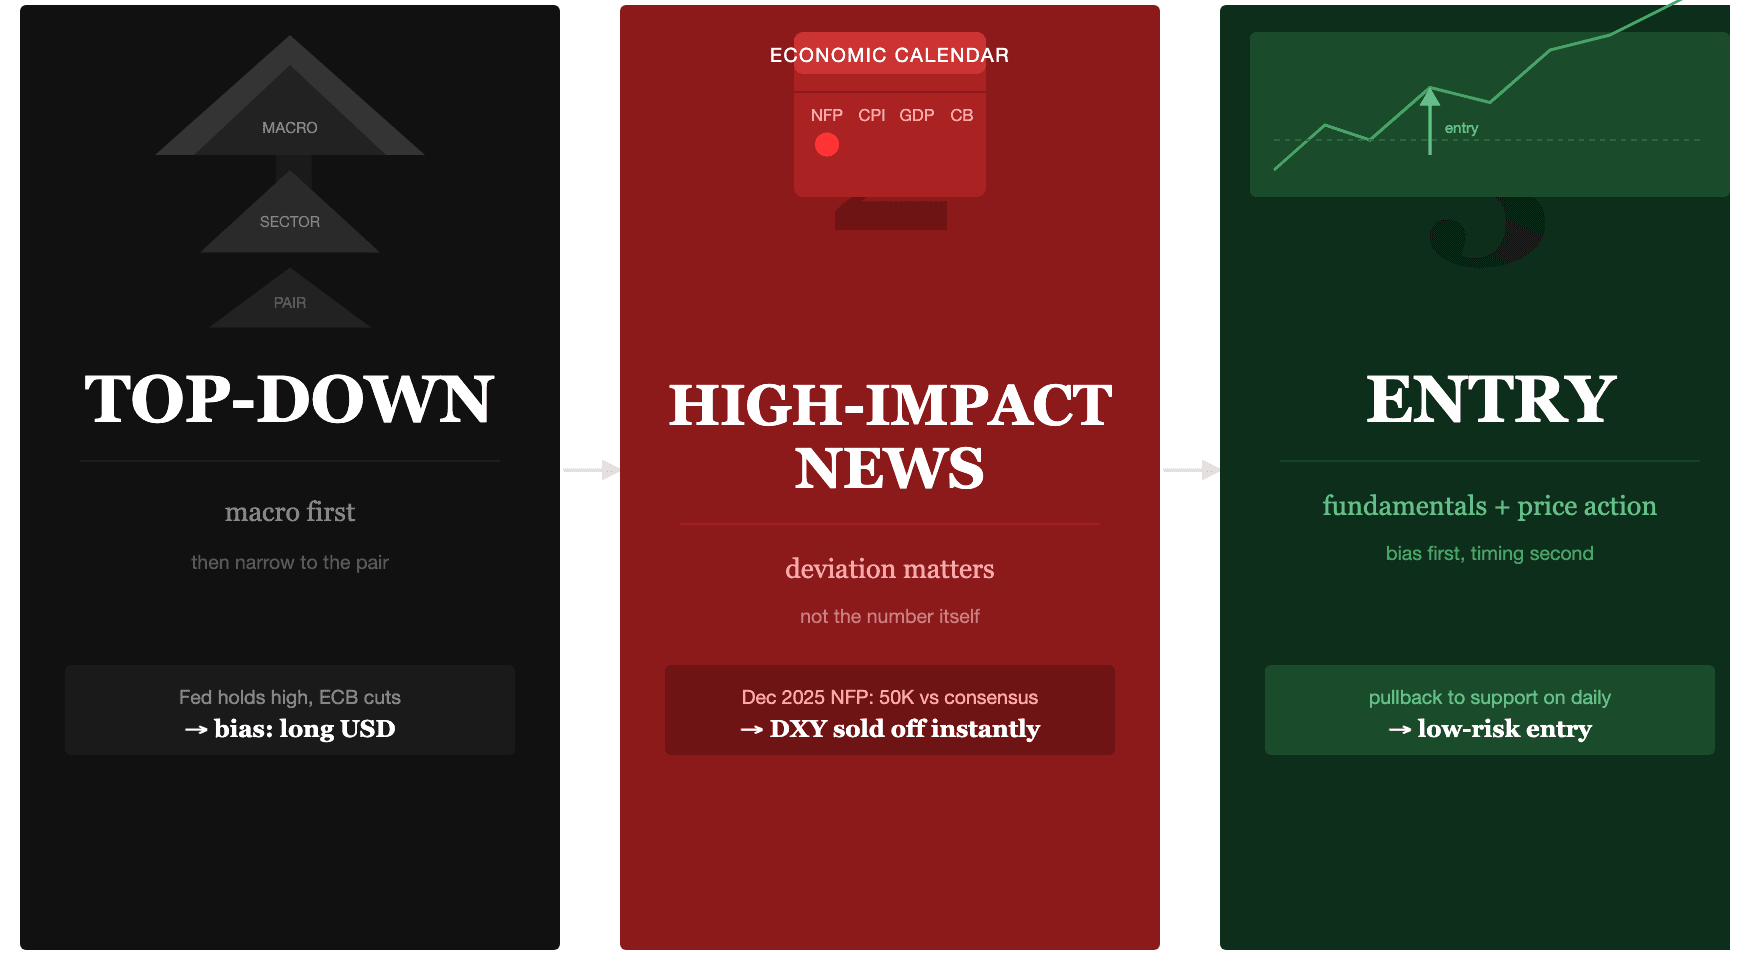
  • Jan. 2026 NFP consensus sat at +70K jobs, DXY tested 98.00 support 
  • A single weak NFP print pushed the DXY toward 97.60 within hours

Strong economy equals more foreign investment. Higher investment equals higher demand for that currency. Higher demand equals a rising price. Each of these numbers marks a moment where the market moved on data, not on a chart pattern. That is the core of fundamental analysis trading.

What Is Fundamental Analysis in Trading

What Is Fundamental Analysis in Trading

Fundamental analysis reads economic, political, and financial data to understand why an asset trades at its current price. It also signals where the price moves next. Technical analysis reads past price action. Fundamental analysis reads the forces that create price action in the first place. For traders on SuperTrade, mastering both gives you an edge that chart-only traders never develop.

"Price does not move randomly. Every major trend starts with a fundamental shift. The chart shows you where the market went. Fundamentals tell you why."

Fundamental Analysis vs Technical Analysis

Trading fundamental analysis and technical analysis answer different questions. Technical analysis asks where the price has been and where it is likely to go based on that history. Fundamental analysis asks what economic reality justifies the current price level.

Technical traders read charts, indicators, and volume. Fundamental traders read central bank decisions, employment reports, and GDP data. Neither approach works fully without the other.

ApproachWhat it readsBest used for
Technical analysisPrice history, patterns, indicatorsEntry and exit timing
Fundamental analysisEconomic data, central bank policy, geopoliticsDirection and bias
Combined approachBothHigher probability setups

The most consistent traders use fundamentals to set direction and technicals to time the entry. Relying on one alone means working with half the picture.

Why Ignoring Fundamentals Costs Prop Traders Their Funded Accounts

Only 7% of over 300,000 accounts achieved payouts, per FPFX Technology data covering 10 prop firms. Most failures do not come from bad strategies. They come from trading into high-impact news events blind to the direction of the move.

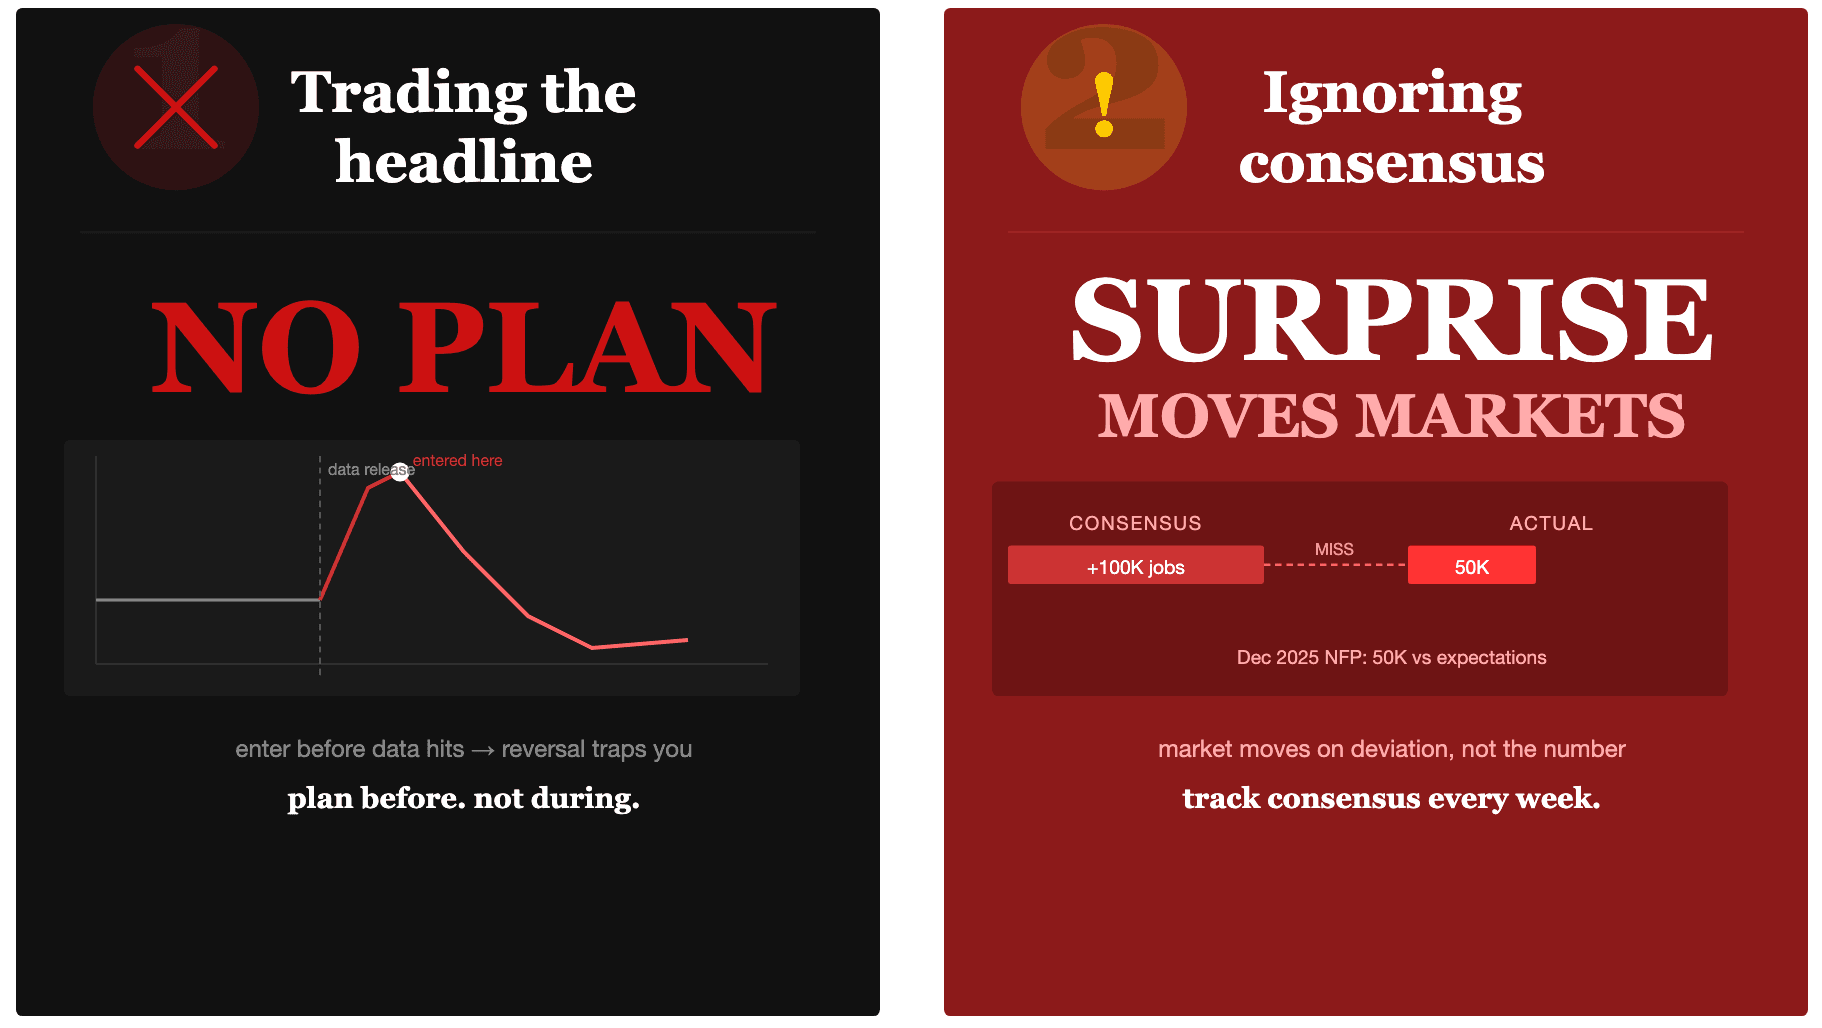
Picture a trader holding a short EUR/USD before a strong US jobs report. The data beat consensus—the dollar surges. The position hits the daily drawdown limit before the trader reacts. That outcome has nothing to do with bad luck. That trader applied no fundamental analysis, meaning in practice.

Traders who track economic releases know which way the market leans before the data hits. They position accordingly or stay flat. That single decision protects the account.

Key takeaway: Fundamental analysis reads the forces that drive price. Technical analysis reads what the price has already done. Prop traders who ignore fundamentals walk into high-impact events blind. That blindness, not a bad strategy, causes most funded account failures.

The Key Indicators in Fundamental Trading

The Key Indicators in Fundamental Trading

Fundamental trading starts with knowing which releases actually move markets and which ones the market ignores. Not every economic report creates a tradeable event. The ones that do share one feature: they give central banks a reason to change interest rates. 

“Rate changes directly affect currency value. Track these three categories above everything else.”

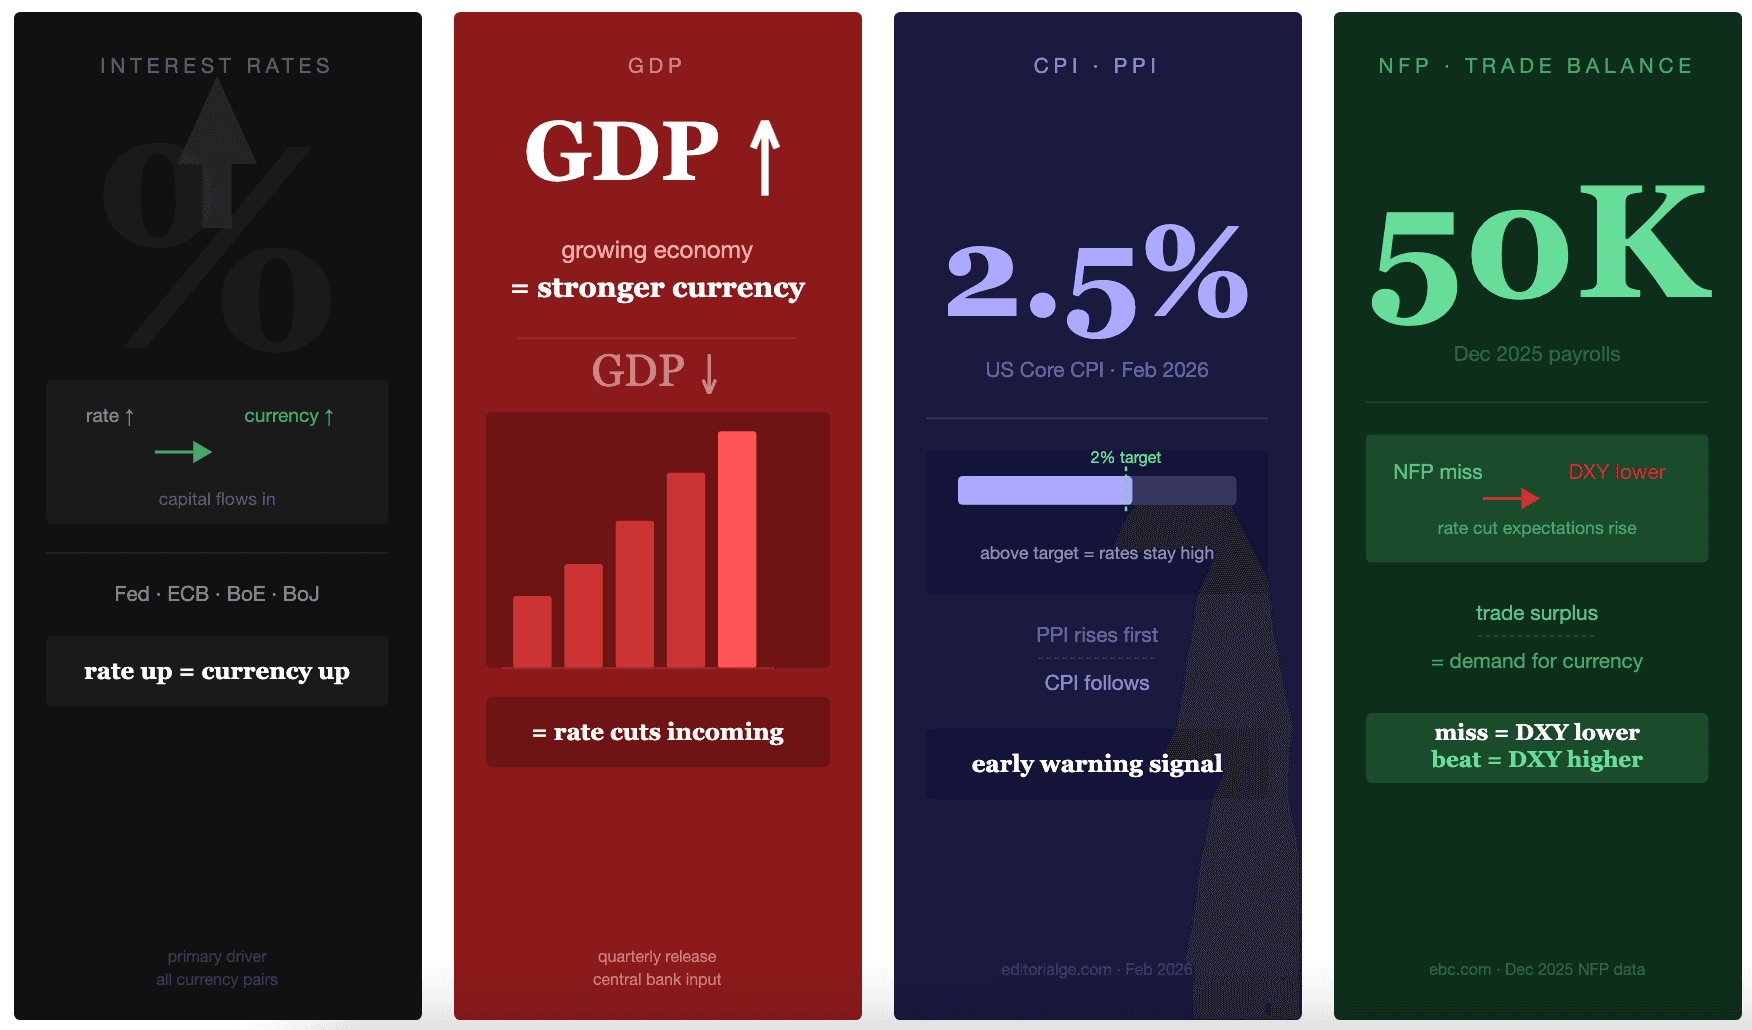
Interest Rates and Central Bank Policy

Interest rates sit at the top of every fundamental trader's list. When a central bank raises rates, its currency attracts global capital seeking yield. Demand for that currency rises. The exchange rate follows.

The Fed, ECB, Bank of England, and Bank of Japan all set base rates that drive their respective currency pairs. Traders track not just the rate decision but the language around it. A central bank signaling future hikes turns bullish for that currency before the hike even happens.

In early 2026, the ECB held a higher-for-longer rate stance. That kept EUR yields elevated and drove steady demand for the euro. 

GDP and Inflation Indicators

GDP measures total economic output. Rising GDP signals a growing economy and typically a strengthening currency. Falling GDP signals contraction. It pushes the central bank toward rate cuts, which weakens the currency.

The Consumer Price Index tracks the cost of a fixed basket of goods. When CPI climbs too fast, central banks raise rates to cool demand. US Core CPI sat at 2.5% in February 2026. A trader watching that number anticipated the Fed keeping rates higher for longer. That single read pointed toward dollar strength against currencies with falling rates.

The Producer Price Index tracks inflation from the producer side. Rising PPI typically leads to rising CPI in the following months. That gives traders an early signal before the bigger market-moving release arrives.

Employment Data and Trade Balance

Employment reports directly affect rate expectations. Strong jobs numbers mean consumers spend, businesses hire, and the economy needs no stimulus. The central bank holds rates higher. The currency strengthens.

In December 2025, US nonfarm payrolls added just 50,000 jobs with unemployment at 4.4%. That weak reading built market expectations for Fed rate cuts in 2026. It pushed the DXY lower. Any trader tracking that release understood why the dollar came under pressure heading into January.

Become a Confident Trader

Master trading with our structured course designed for beginners and intermediate traders.

Step-by-step lessons
Real strategies
Risk management training

Join 10,000+ traders improving their skills

Start Course Now

The trade balance measures exports minus imports. A trade surplus signals high demand for a country's goods and therefore for its currency. A growing deficit signals the opposite.

Key takeaway: Three pillars drive fundamental trading. Interest rates set the direction. GDP and CPI data confirm the macro trend. Employment and trade data update the picture between central bank meetings. Track all three, and you know the market's likely bias before price moves.

How to Use Fundamental Analysis in Trading: Step by Step

How to Use Fundamental Analysis in Trading: Step by Step

Applying the basics of fundamental analysis comes down to a repeatable three-step process. The goal is not to predict every move. The goal is understanding the macro environment well enough to avoid trading against it. Here are the three steps.

Step 1 — Top-Down vs Bottom-Up: Choose Your Approach

Top-down analysis starts with the global economic picture. You identify which economies strengthen and which weaken. Then you narrow to specific pairs or assets that reflect that view.

A top-down trader in early 2026 noted that the Fed kept rates high while the ECB signaled future rate cuts. That view pointed to dollar strength against the euro. The trader then looked for a technical setup on EUR/USD aligned with that fundamental bias.

Bottom-up analysis starts with the specific asset. A trader watching GBP/USD starts with the Bank of England rate stance. Then the UK employment data. Then the broader risk environment.

Top-down suits traders who want macro clarity first. Bottom-up suits traders are already focused on specific pairs—both work. Mixing them without a clear process does not.

Step 2 — How to Identify High-Impact News Before It Hits

Not all economic releases move markets equally. High-impact events produce the largest deviations from consensus and the fastest price moves. Mark these on your calendar every week before you open a chart:

  • NFP and unemployment rate
  • Central bank rate decisions
  • CPI and Core CPI
  • GDP quarterly data
  • Trade balance reports

The key number is never the result itself. The key number is the deviation from consensus. When the December 2025 NFP printed at 50,000 against higher expectations, the miss drove immediate dollar selling. A trader who knew the consensus understood instantly why the market moved and in which direction.

Step 3 — Combining Fundamentals With Price Action Entry

Fundamentals give you direction. Price action gives you timing. Combined, they produce higher-quality setups than either approach alone.

Start by establishing your fundamental bias. The Fed holds rates high. The Bank of Japan keeps rates near zero. Your bias is long USD/JPY. Next, wait for a technical setup that aligns. A pullback to key support on the daily chart gives you a low-risk entry aligned with the fundamental trend. Then set your stop below that level and let the driver work.

Trading against a strong fundamental trend because a chart pattern looks attractive blows prop challenges out of the water.

Key takeaway: Performing fundamental analysis follows three steps. Pick your approach: top-down for macro clarity, bottom-up for asset-specific analysis. Identify the high-impact release that changes the picture. Combine the fundamental bias with a technical entry. Data plus price action beats either approach alone.

Fundamental Analysis in Forex, Crypto, and Swing Trading

Fundamental Analysis in Forex, Crypto, and Swing Trading

What is fundamental analysis? In forex, crypto, and swing trading, the same core logic applies. The indicators that matter and the timing of their impact differ by market. Here is how to apply the approach across the three markets SuperTrade traders use most.

Fundamental Analysis in Forex Trading

Fundamental analysis in forex centers on interest rate differentials between two countries. EUR/USD, GBP/USD, and USD/JPY move primarily on central bank divergence. The Fed raises rates while the ECB cuts. EUR/USD falls. The Bank of Japan raises rates after years near zero. USD/JPY falls sharply.

The forex market trades $9.6 trillion per day. EUR/USD accounts for 21.2% of that volume. Fundamentally-driven moves in forex happen fast. A US CPI miss moves EUR/USD in seconds.

Fundamental Analysis in Crypto Trading

Crypto trading responds to a different set of fundamentals. Regulatory decisions, macro risk sentiment, and liquidity conditions drive crypto prices more than traditional economic indicators.

When the Fed signals rate cuts, risk assets, including crypto rally. When inflation surprises to the upside and rate hike expectations rise, crypto sells off alongside equities. In 2025, crypto accounted for 10-20% of total trading volume across many prop platforms. Macro sentiment now matters as much for crypto traders as it does for forex traders.

How Swing Traders Use Fundamental Analysis

Swing trading holds positions for days to weeks. That time frame makes fundamental analysis more relevant than for scalpers. Swing traders do not need to react to every release. They need the dominant macro trend and trade in its direction.

A swing trader in early 2026 with the view that the Fed would keep rates elevated had a clear bias. Long USD against low-rate currencies. That view did not require trading every NFP. It required holding the bias across multiple setups over the course of weeks.

Earnings data, sector rotation, and shifts in commodity supply drive swing opportunities in stocks. In forex, central bank meeting cycles provide natural swing-trade catalysts every six to eight weeks.

Key takeaway: Fundamental analysis in forex targets interest rate differentials. In crypto, it tracks macro sentiment and liquidity. In swing trading, it defines the multi-week directional bias. The indicators differ by market. The core logic stays the same. Strong economic outlook equals demand for that asset.

Real Trade Example: January 2026 NFP Release

The January 2026 NFP release shows exactly how fundamental trading works in real time. The report was released on February 11, 2026, after a delay due to the partial US government shutdown. It included annual benchmark revisions for all 2025 payroll data. That made the release unusually market-moving.

  • Before the release, the consensus sat at +70,000 jobs. The DXY tested 98.00 support. Market pricing pointed toward two Fed rate cuts in 2026. The dollar already faced pressure from weak expectations. A miss below 50,000 would push DXY toward 97.60. A beat above 120,000 would trigger short-covering toward 99.30.
  • The trade approach: A fundamental trader did not guess the number. They planned two scenarios, each with clear price levels. They knew the consensus, the key DXY levels, and the Fed's stated position. That preparation removed the need for any decision after the data hit.
  • The lesson: The value of fundamental analysis is not predicting the exact number. It means knowing market expectations before the event. Then you read the deviation the moment the data lands.

Key takeaway: Every major data release has two parts. The number itself and how far it deviates from the consensus. Fundamental traders plan both scenarios before the release. That preparation turns a reactive scramble into a controlled, pre-planned trade.

Common Mistakes Traders Make With Fundamental Analysis

Common Mistakes Traders Make With Fundamental Analysis

Most traders who attempt fundamental analysis trading repeat the same errors. The errors do not come from the approach. They come from applying it without discipline.

Trading the News Without a Plan

The most common mistake is entering a trade the instant a data release hits: no pre-defined plan, no knowledge of the consensus, no pre-set price levels. The initial move after a major release often reverses sharply. Traders who react to the headline get caught in that reversal.

Plan the trade before the release. Define the bullish scenario. Define the bearish scenario. Define the price levels that confirm each one. Then wait for the market to show its hand.

Ignoring the Consensus: Why Surprises Move Markets

A release that matches consensus barely moves the market. One that misses or beats significantly moves it hard and fast. Many beginner traders focus on whether a number looks good or bad in absolute terms. The market ignores absolute terms.

December 2025 NFP printed 50,000 jobs. That number alone was not catastrophic. But the consensus expected more. The surprise immediately drove the dollar lower. A trader reading only the headline missed the reason for the move. A trader tracking the consensus understood it instantly.

Key takeaway: Two mistakes kill fundamental traders. Trading the headline without a plan and ignoring the consensus expectation. Build your scenarios before the release. Trade the deviation, not the reaction.

Final Words

Fundamental analysis reads economic data, central bank policy, and geopolitical events to understand the forces driving prices. The key indicators are interest rates, GDP, CPI, employment data, and trade balance. Apply it in three steps. Establish a macro view. Identify the high-impact release. Combine with a technical entry. 

For prop traders, fundamentals are not optional. Only 7% of accounts achieve payouts. Undisciplined trading into high-impact events destroys accounts that a solid strategy would otherwise carry. Plan both scenarios before every major release. Trade the deviation from consensus. Let the fundamental trend do the work.

Frequently Asked Questions

Disclaimer: This article is for informational purposes only and does not constitute financial advice. Trading involves risk and may result in loss of capital.

The First Move Is Yours

Discover how Supertrade can transform your trading career. Explore challenges, access instant funding, and join a growing community of Supertraders.

Stay Ahead of the Game

Sign up to receive exclusive tips, market insights, and the latest updates from Supertrade. Don’t miss out on opportunities to grow your trading success.
Discord

Our Community

Do not skip any beat.

The Ultimate Trading Community. Join our Discord server to get the latest updates, news and more.

2026 Supertrade. All rights reserved
DiscordFacebookInstagramTelegramYouTubeXTikTok
Trading involves significant risk. Past performance is not indicative of future results. This is a simulated trading environment. Supertrade provides educational trading services.
Supertrade
Supertrade Ltd, a company incorporated under the laws of Saint Lucia with registered number 2024-00699, located at Ground Floor, Rodney Court Building, Rodney Bay, Gros Islet, Saint Lucia, LC01 101, operates and owns this website, as well as provides services under the Terms and Conditions posted on the website. Supertrade Prop Ltd, a company incorporated under the laws of England and Wales with registered number 16234284, located at 52-56 Standard Road, London, England, NW10 6EU, acting as a payment agent.