Fundamental Analysis

May 13, 2026 - 10 min

Beginner

Market Cap Meaning: What It Is, How to Calculate It, and Why It Matters

Market Cap Meaning: What It Is, How to Calculate It, and Why It Matters

Market capitalization tells you what the stock market values a company at right now. Market cap meaning starts with one formula: share price multiplied by shares outstanding. Every index ranking and valuation ratio is based on that number. This article explains how to calculate it, what the five size categories mean for your risk, and where market cap actively misleads you.

Justin Freeman
Reviewed by:
Share

What Every Investor Should Know About Market Cap First

  • The formula never changes: price × shares.
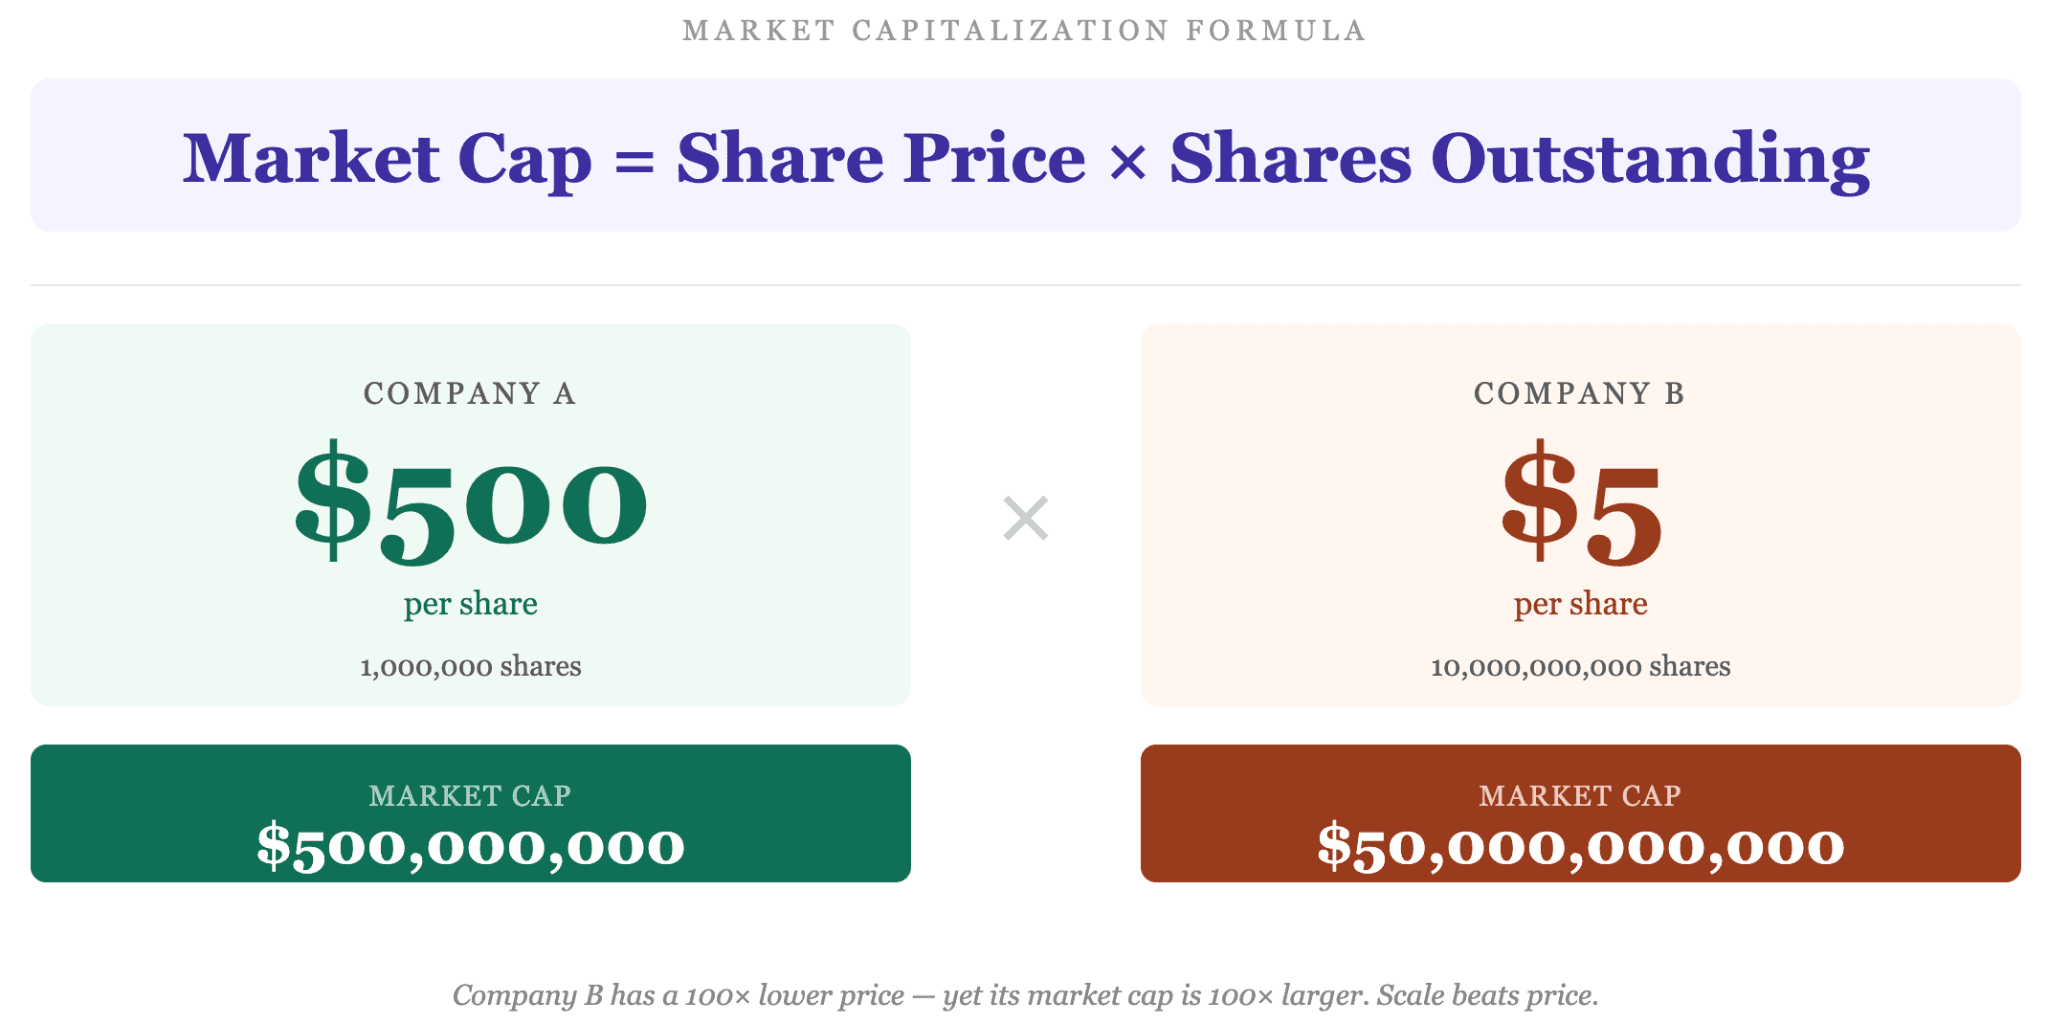
  • Scale beats price. $5 stock, 10B shares beats $500 stock, 1M shares.
  • The S&P 500 had a total market cap of $61.1 trillion as of December 31, 2025.
  • NVIDIA crossed $5 trillion in October 2025, a milestone no company had ever reached.
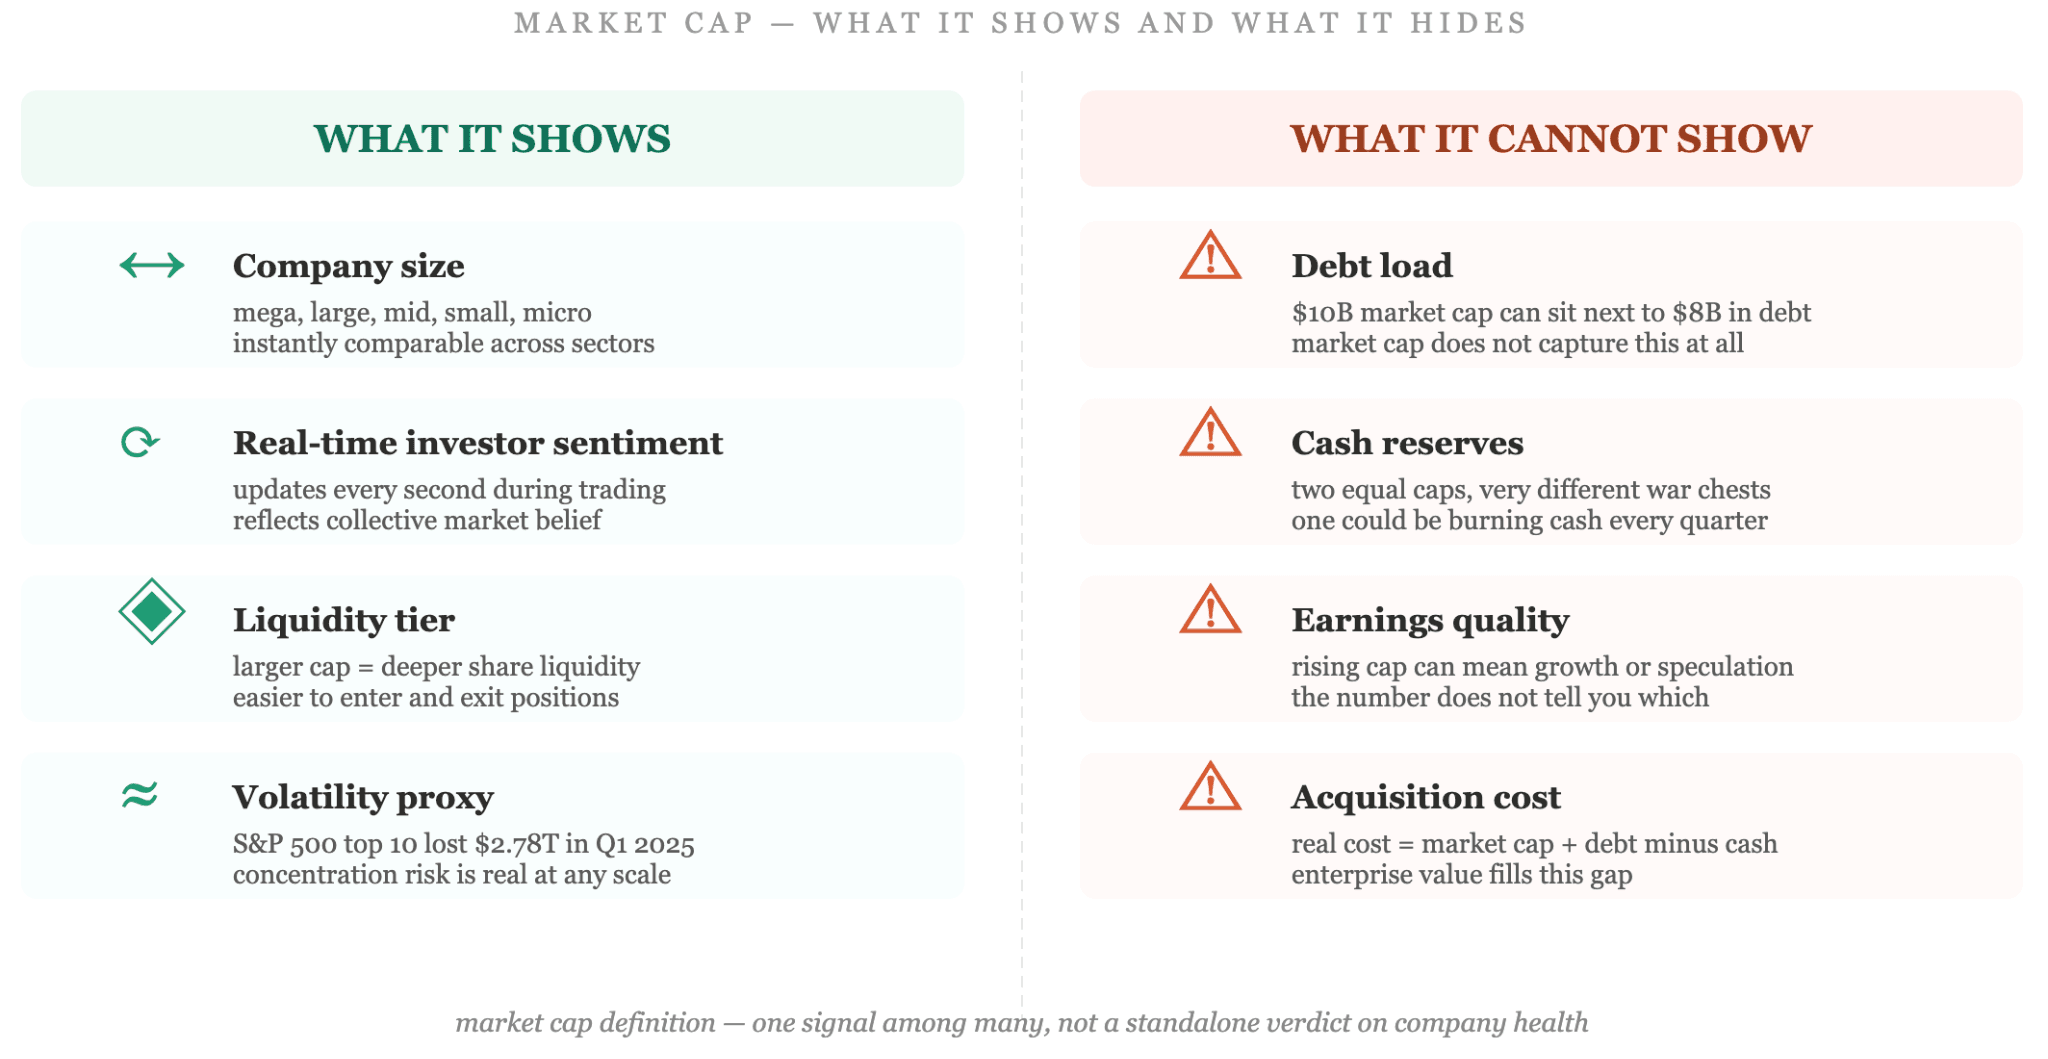
  • Market cap reflects sentiment, not balance sheet value.
  • S&P 500 entry requires at least $22.7 billion in market cap as of July 1, 2025.

What Is Market Cap and How Is It Calculated

What Is Market Cap and How Is It Calculated

Market capitalization is the total dollar value the market assigns to all of a company's outstanding shares at any given moment. It shifts every time the stock price moves, which means analysts treat it as a live signal, not a fixed number. According to Charles Schwab, market cap matters because investors and index creators use it to group companies and frame their analysis.

The Market Capitalization Formula

The market capitalization formula is one of the simplest calculations in finance. Let’s check it right away:


Market Cap = Current Share Price x Total Shares Outstanding


That is it. A company with 500 million shares trading at $40 carries a market cap of $20 billion. A company with 50 million shares at $200 carries a market cap of $10 billion. The second company has a higher share price but a smaller market cap. Without knowing how many shares exist, price alone tells you nothing useful about size.

The formula applies to any publicly traded company. For digital assets, analysts apply a diluted version that counts all tokens or shares a company could eventually issue, not just those already in circulation. Messari, a leading crypto research firm, uses this diluted market cap methodology to give a fuller picture of a digital asset's potential supply pressure on price.

How to Calculate Market Cap Step by Step

Calculating market cap takes three steps. Here they are:

  1. Find the current stock price on any financial data terminal
  2. Find total shares outstanding in the latest quarterly filing
  3. Multiply the two numbers

Example: A company with 1 billion shares outstanding and a stock price of $50 carries a market cap of $50 billion. The number updates in real time during trading hours. Outside market hours, it reflects the last traded price. The share price is half of the equation, and it moves constantly. The shares outstanding half move more slowly, through corporate actions covered in the next section.

What Moves a Company's Market Cap Over Time

What Moves a Company's Market Cap Over Time

Market cap changes when the stock price moves, when the share count changes, or when both move at once. Share price moves on earnings reports, macro conditions, analyst revisions, product cycles, and market sentiment. The share count changes through deliberate corporate decisions.

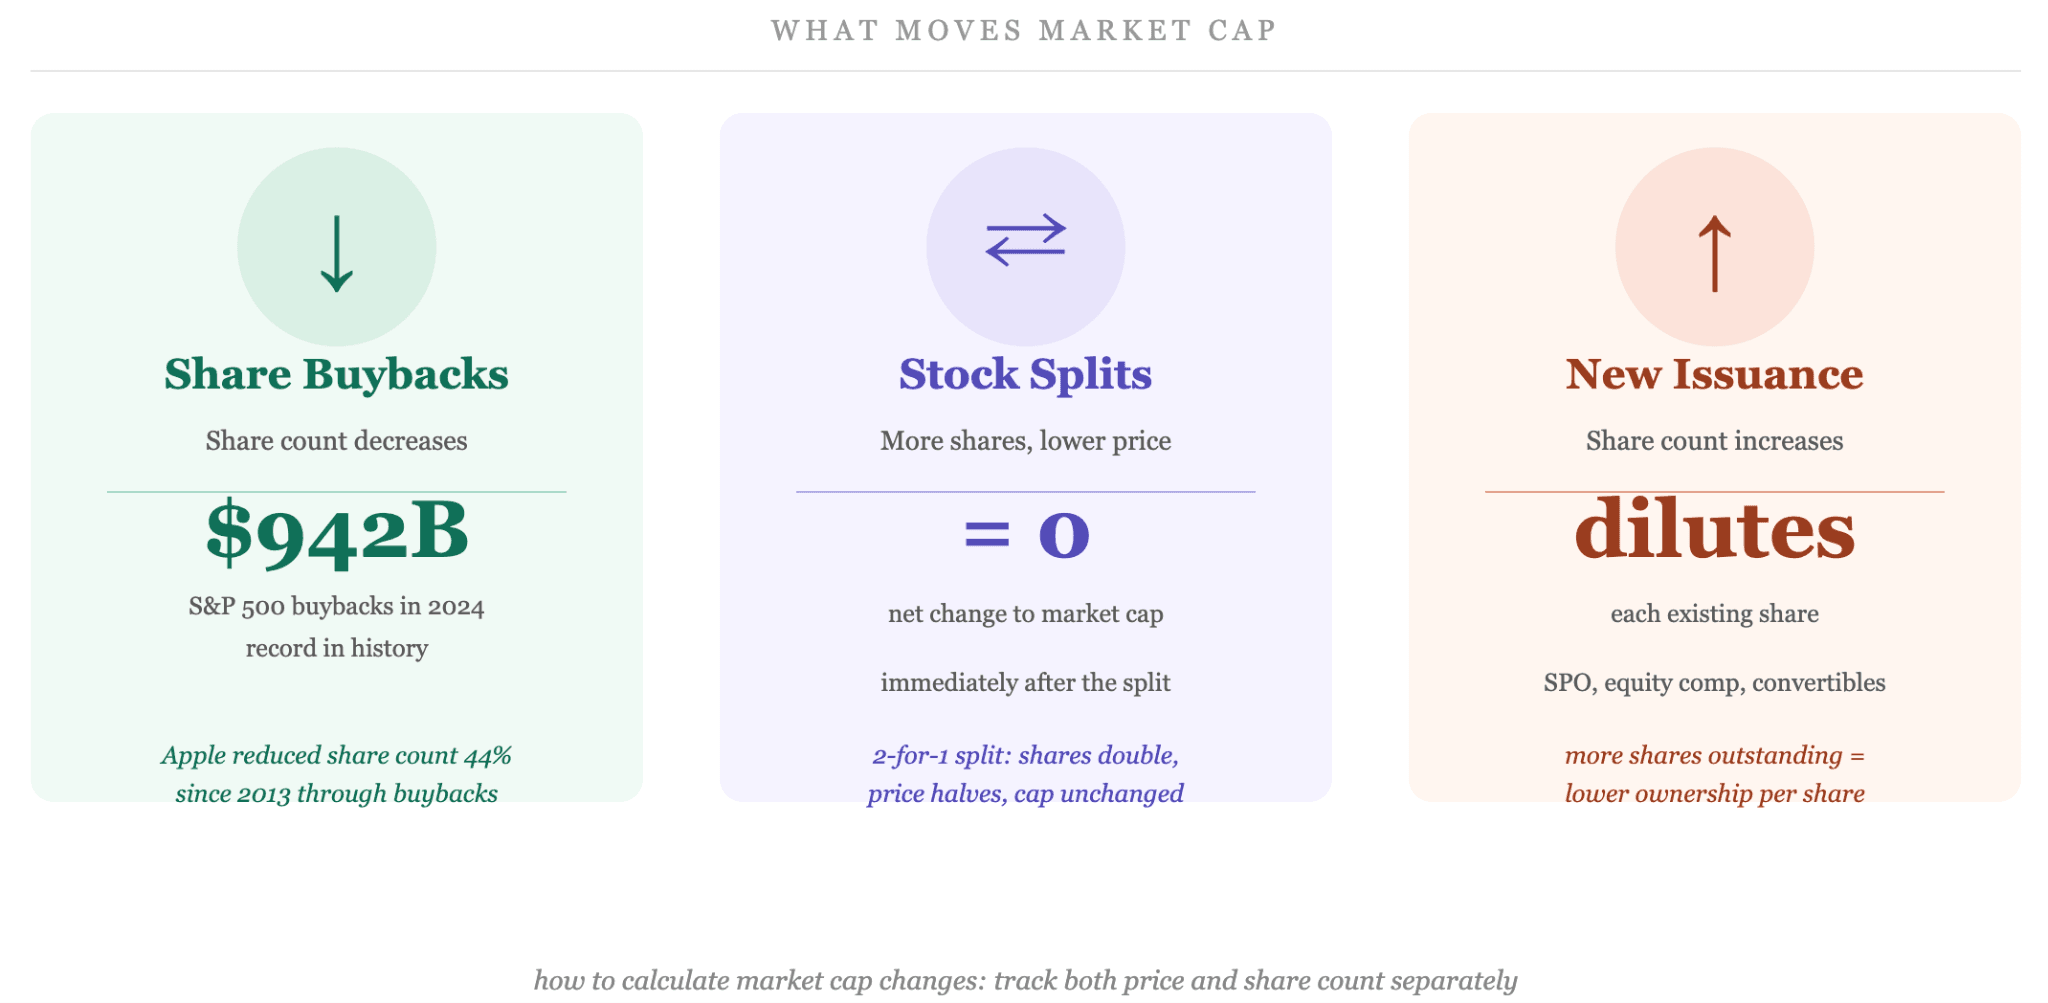
The main corporate actions that change share count are:

  • Share buybacks: the company repurchases its own shares, reducing the total count
  • Secondary offerings: the company issues new shares, increasing the total count
  • Stock splits: share count rises, price drops proportionally, market cap unchanged
  • Share-based compensation: employees receive shares, gradually raising the total count

S&P 500 companies spent a record $942.5 billion on buybacks in 2024, up 18.5% from 2023, according to S&P Dow Jones Indices. Apple reduced its outstanding share count by more than 44% since launching its buyback program in 2013, according to CNBC. That shows how aggressively corporate decisions can reshape a share structure without touching the underlying business at all.

Key takeaways: Market cap equals share price multiplied by shares outstanding. The formula never changes, but both inputs do. Share price moves daily. Share count changes through buybacks, new issuances, splits, and equity compensation.

Market Cap Categories: From Micro to Mega

Market Cap Categories: From Micro to Mega

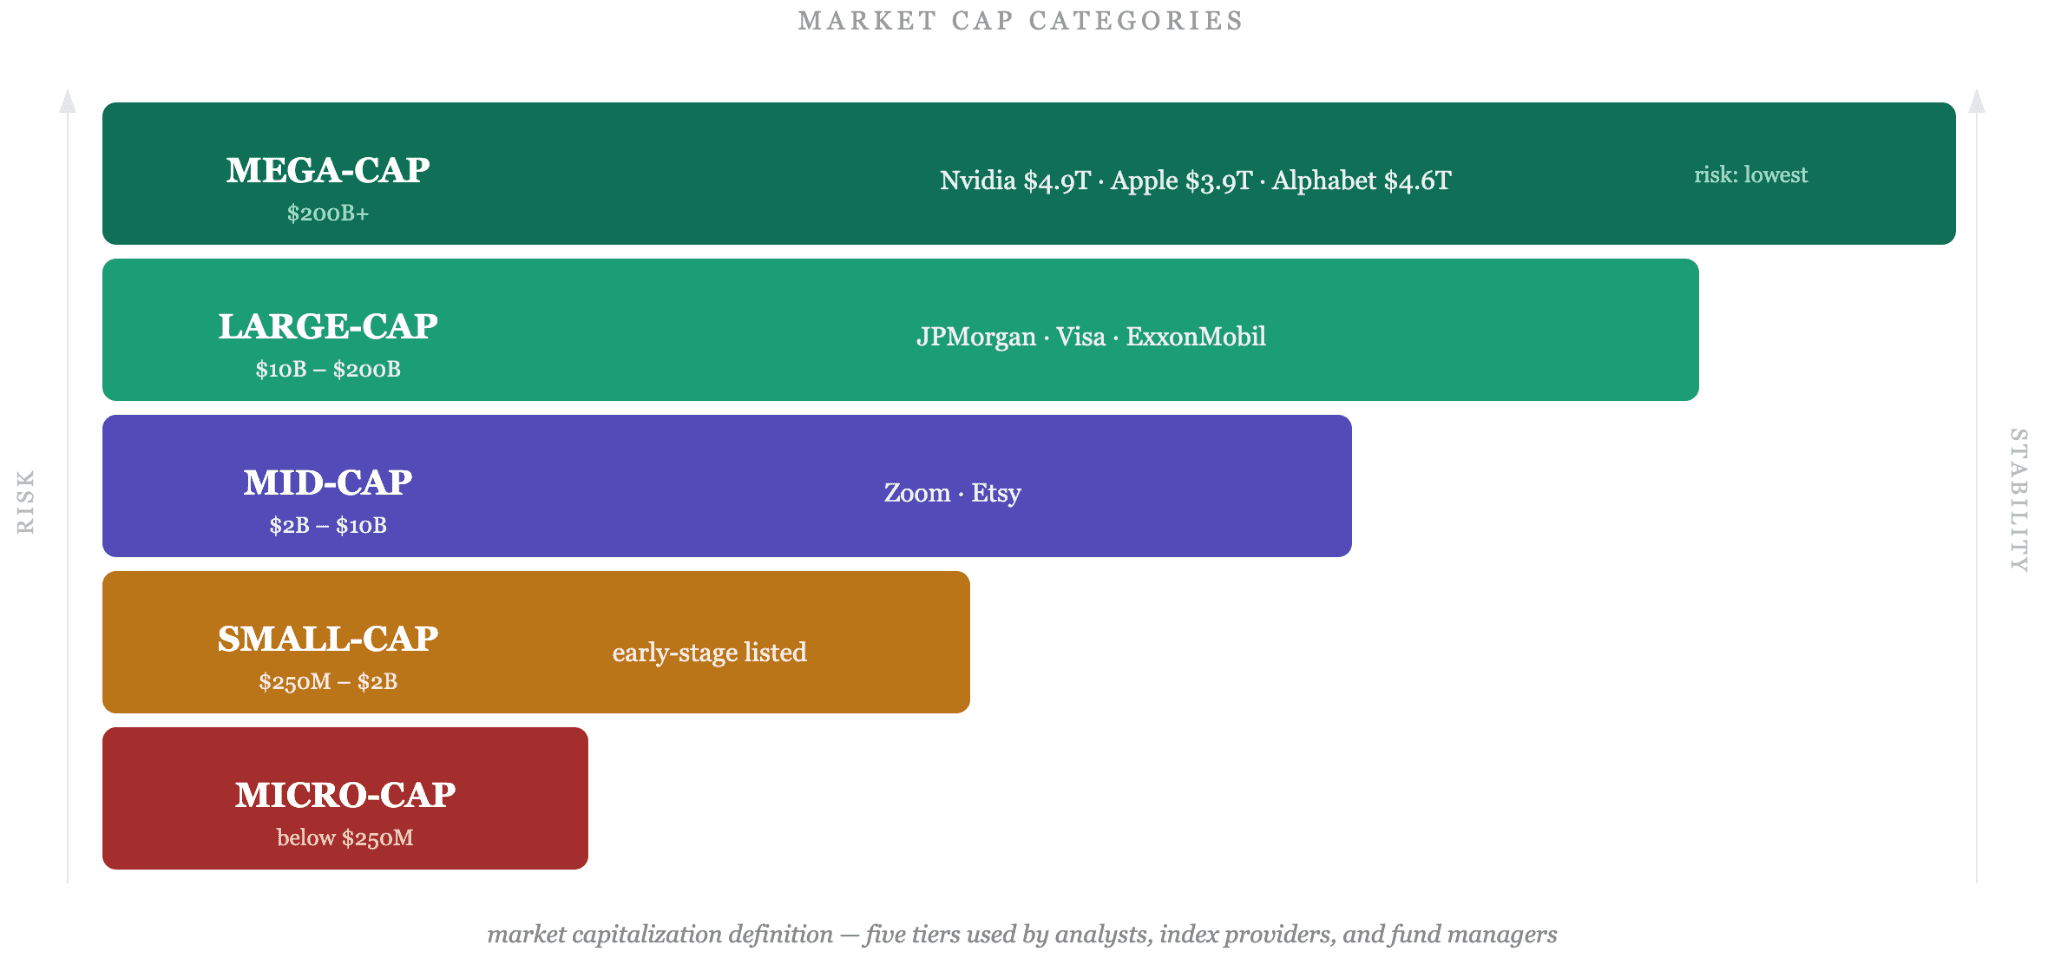
Companies fall into five tiers based on their market capitalization. These are working classifications used by analysts, index providers, and fund managers, not legal categories. The boundary values differ slightly across data providers, but the ranges below reflect the most widely used standards. Each tier carries a distinct risk profile and growth expectation, which makes the classification practical for portfolio construction and risk management.

Mega-Cap and Large-Cap Companies

Mega-cap companies carry market caps above $200 billion. Large-cap companies have a market capitalization between $10 billion and $200 billion.

Become a Confident Trader

Master trading with our structured course designed for beginners and intermediate traders.

Step-by-step lessons
Real strategies
Risk management training

Join 10,000+ traders improving their skills

Start Course Now

As of May 2026, Nvidia leads all publicly traded companies by market cap, with a valuation approaching $5 trillion, followed by Alphabet and Apple, according to CNBC. Eight of the ten largest S&P 500 companies by index weight belong to the technology sector. That concentration at the top directly impacts any index weighted by market cap. The top ten S&P 500 components account for approximately 38% of the entire index's market capitalization.

Mega-cap and large-cap companies typically access cheaper financing, generate more stable revenue, and carry deeper share liquidity. Viraj Desai, director of Charles Schwab Investment Management, put it plainly: "Larger-cap companies generally have a track record of long-term success and stability." They are generally more resilient in market downturns than smaller peers.

Mid-Cap Companies

Mid-cap companies have a market cap between $2 billion and $10 billion. This tier comprises companies that have passed the riskiest growth stage but are still actively expanding their market position. 

Mid-caps can deliver faster revenue growth than large-caps while carrying less volatility than small-caps. Analysts sometimes call this the growth-stability middle ground, where companies have enough scale to absorb setbacks but enough momentum to outperform in strong markets.

Small-Cap and Micro-Cap Companies

Small-cap companies range from $250 million to $2 billion in market capitalization. Micro-cap falls below $250 million.

Smaller companies typically face restricted access to debt markets, thinner share liquidity, and higher sensitivity to macro conditions. The Russell 2000, which tracks US small-cap stocks, showed buyback volume dropping 7.1% quarter-over-quarter in Q1 2024, according to VerityData

Now, let’s see the market cap categories in a comparison table below:

CategoryMarket Cap RangeRisk LevelTypical Investor ProfileExamples (May 2026)
Mega-cap$200B and aboveLow to moderateConservative, long-termNVIDIA, Apple, Alphabet
Large-cap$10B to $200BModerateBalanced, dividend-seekingJPMorgan, Visa, ExxonMobil
Mid-cap$2B to $10BModerate to highGrowth-orientedZoom, Etsy
Small-cap$250M to $2BHighAggressive growthEarly-stage listed firms
Micro-capBelow $250MVery highSpeculativeNano-cap and startup listings

Key takeaways: The five market cap tiers provide a practical framework for matching company size to risk tolerance and investment goals.

What Market Cap Tells You and What It Does Not

What Market Cap Tells You and What It Does Not

Market capitalization provides a real-time signal of investor sentiment, not a balance-sheet reading. Every market cap figure reflects what buyers and sellers agreed to pay at one specific moment in time. Knowing the difference between what it reveals and what it hides is what separates a useful analysis from a shallow one.

Market Cap as a Risk and Volatility Indicator

Market cap works as a proxy for stability in stock analysis. Larger companies generally exhibit lower price volatility because their shares trade with greater liquidity, more analyst coverage, and broader institutional ownership.

Small-cap stocks carry higher volatility because fewer shares trade each day. A single large order can significantly move the price. That cuts both ways: faster gains in bull markets, sharper drawdowns in corrections.

Large-cap companies are not immune to sharp moves either. During Q1 2025, the top ten S&P 500 companies collectively lost $2.78 trillion in market cap, while the remaining 493 index components gained $325 billion over the same period. Concentration risk exists even at the very top of the market cap scale.

What Market Cap Cannot Show You?

Market cap tells you what the market pays for equity right now. It says nothing about any of the following:

  • Debt load: $10B market cap can sit next to $8B in debt
  • Cash position: two equal market caps, very different cash reserves
  • Earnings quality: A rising market cap can mean growth or pure speculation
  • Intrinsic value: market cap reflects belief, not fundamental worth
  • Acquisition cost: real cost includes debt, minus cash

Treating market cap as a complete picture of a company's health is one of the most common mistakes in stock analysis. "Big moves in market cap get attention, but market cap is just a starting point for what you'll need to know," said Viraj Desai of Charles Schwab Investment Management. It is one useful signal among several, not a standalone verdict.

Market Cap vs Enterprise Value: The Key Difference

Market Cap vs Enterprise Value

Enterprise value gives a more complete picture of what a company actually costs to acquire outright.


EV = Market Cap + Total Debt minus Cash and Cash Equivalents


A company with a $5 billion market cap, $2 billion in debt, and $500 million in cash carries an enterprise value of $6.5 billion. The market cap figure understates the real acquisition cost by $1.5 billion in that example. Analysts use EV-to-EBITDA ratios rather than market-cap-based ratios for acquisition analysis precisely because of this gap. Market cap captures equity value. Enterprise value captures total firm value.

Key takeaways: Market cap shows what the market values equity at right now. It does not tell you about debt, cash, earnings quality, or intrinsic worth. Enterprise value fills in those gaps.

How Market Cap Is Used in Stock Analysis

How Market Cap Is Used in Stock Analysis

Market cap is the starting input for most of the ratios analysts use to compare companies across sectors and size categories. Knowing how to calculate market cap is only part of the job. Knowing which ratios it feeds into and what each one actually measures is where the analytical value lies.

Market Cap in Financial Ratios

Any ratio that starts with "price to" draws directly on market cap or uses share price as a primary input. The table below covers the most widely used examples.

RatioFormulaWhat It Measures
Price-to-Earnings (P/E)Market Cap divided by Net IncomeWhat investors pay per dollar of earnings
Price-to-Sales (P/S)Market Cap divided by Annual RevenueValuation relative to top-line revenue
Price-to-Book (P/B)Market Cap divided by Book Value of EquityPremium over the accounting value of assets
EV to EBITDAEnterprise Value divided by EBITDAOperating value, independent of capital structure

The P/E ratio is the most widely cited. A company with a market cap of $10 billion and net income of $500 million trades at a P/E of 20. A second company with the same market cap but $200 million in net income trades at a P/E of 50. Market cap alone tells you nothing about which is cheaper.

Free-Float Market Cap and Index Weighting

Standard market cap counts all shares outstanding, including those held by insiders, governments, or locked-up institutions that the public cannot trade. Free-float market cap strips out shares that are not freely tradable and counts only shares that trade openly in the market.

Major indices use free-float weighting because it reflects actual investable supply. The S&P 500 applies free-float market-cap weighting, meaning a company's index weight reflects shares the public can actually buy, not the company's full share count. 

Key takeaways: Market cap feeds directly into the most widely used valuation ratios in equity analysis. P/E, P/S, and P/B all rely on it as a primary input. 

Final Words

Market cap meaning starts with one formula and builds into multiple layers of practical application. Share price multiplied by shares outstanding gives you the number. What that number tells you depends entirely on how you apply it. Market cap reveals size, liquidity tier, and real-time investor sentiment. It does not reveal debt levels, cash reserves, earnings quality, or intrinsic worth.

Frequently Asked Questions

Disclaimer: This article is for informational purposes only and does not constitute financial advice. Trading involves risk and may result in loss of capital.

Related Articles

The First Move Is Yours

Discover how Supertrade can transform your trading career. Explore challenges, access instant funding, and join a growing community of Supertraders.

Stay Ahead of the Game

Sign up to receive exclusive tips, market insights, and the latest updates from Supertrade. Don’t miss out on opportunities to grow your trading success.
Discord

Our Community

Do not skip any beat.

The Ultimate Trading Community. Join our Discord server to get the latest updates, news and more.

2026 Supertrade. All rights reserved
DiscordFacebookInstagramTelegramYouTubeXTikTok
Trading involves significant risk. Past performance is not indicative of future results. This is a simulated trading environment. Supertrade provides educational trading services.
Supertrade
Supertrade Ltd, a company incorporated under the laws of Saint Lucia with registered number 2024-00699, located at Ground Floor, Rodney Court Building, Rodney Bay, Gros Islet, Saint Lucia, LC01 101, operates and owns this website, as well as provides services under the Terms and Conditions posted on the website. Supertrade Prop Ltd, a company incorporated under the laws of England and Wales with registered number 16234284, located at 52-56 Standard Road, London, England, NW10 6EU, acting as a payment agent.