
With it, they help to forecast where the asset price will move. If you know how to use technical indicators, you can improve your trading performance, and develop a good strategy.
You can use technical indicators to identify trends, reversals, and momentum. Indicators can also help you to see whether an asset is overbought or oversold, and provide signals into potential entry and exit points. Even though indicators don’t guarantee any profits, they can help you get important information about the market and risk management
You can start with the main technical indicators, such as RSI, MACD, ADX, Ichimoku Cloud, On Balance Volume, Stochastic Oscillator, and Parabolic SAR. Each indicator is unique and is used for different cases. For example, some measure momentum, others confirm trends, and other help to forecast reversals, and so on. If you want to trade profitably, you need to learn how these indicators work individually and how you can combine them.
Technical indicators can help you to trade more systematically. For example, you can backtest your strategy, create automated alerts, and reduce the impact of emotions. This all is very helpful in volatile markets where you cannot rely only on your intuition. Indicators provide you with objective information and with it, they help you avoid impulsive decisions.
If you know how to use these indicators, you can apply your knowledge in all types of markets, such as forex, stocks, commodities, and cryptocurrencies. For example, you can combine a momentum indicator, such as RSI, and a trend-following tool, such as MACD to determine the best time to enter the trade. This will also help you to reduce the risks of false signals. If you trade crypto, which is very volatile, technical indicators can help you avoid sudden losses that are caused by price swings.
It is important to understand how to choose the right indicator. It all depends on your strategy, market, and timeframe. For example, day traders may focus on momentum indicators because they are fast moving. If you are a swing trader, you may focus on a trend-following indicator, and so on.
What Are Technical Indicators?
Technical indicators are mathematical calculations that are based on price, volume, or open interest in a security. They can help you analyze trends, measure momentum, and predict potential price movements. Indicators are classified into several categories, such as trend-following, momentum indicators, volatility indicators, and volume-based indicators.
Trend-following indicators are moving averages. They help to determine the direction of the market. They can help you to align your positions with the main trend.
Momentum indicators, such as RSI and Stochastic Oscillator, measure the strength of price movements. They can signal potential reversals or continuation points.
Volume-based indicators, such as On Balance Volume (OBV), offer information about the market participation. If the volume grows, it confirms the trends. If the volume decreases, it shows that the momentum is weakening.
Volatility indicators are Bollinger Bands and Parabolic SAR. They measure price fluctuations and help you to forecast breakout or breakdown scenarios.
Technical indicators are often used in combination with chart patterns and help to make informed decisions. A single indicator may provide signals, but if you know how to combine many indicators, you can boost your efficiency and reduce fasle signals.
You shall also understand that indicators do not predict anything. They interpret the past prices and volume and suggest probabilitikes. This is why you can use them as guidelines, but not guarantees.
You can customize indicator settings so that they fit your trading style. For example, if you are a short-term trader, you can use shorter moving averages. And if you are a long-term investor, you may want to rely on longer trends. It is very important to understand how indicators work in different conditions and for different timeframes. If you know how to analyze trends, momentum, volatility and volume, you can understand better the market conditions and trade more profitably.
RSI Indicator
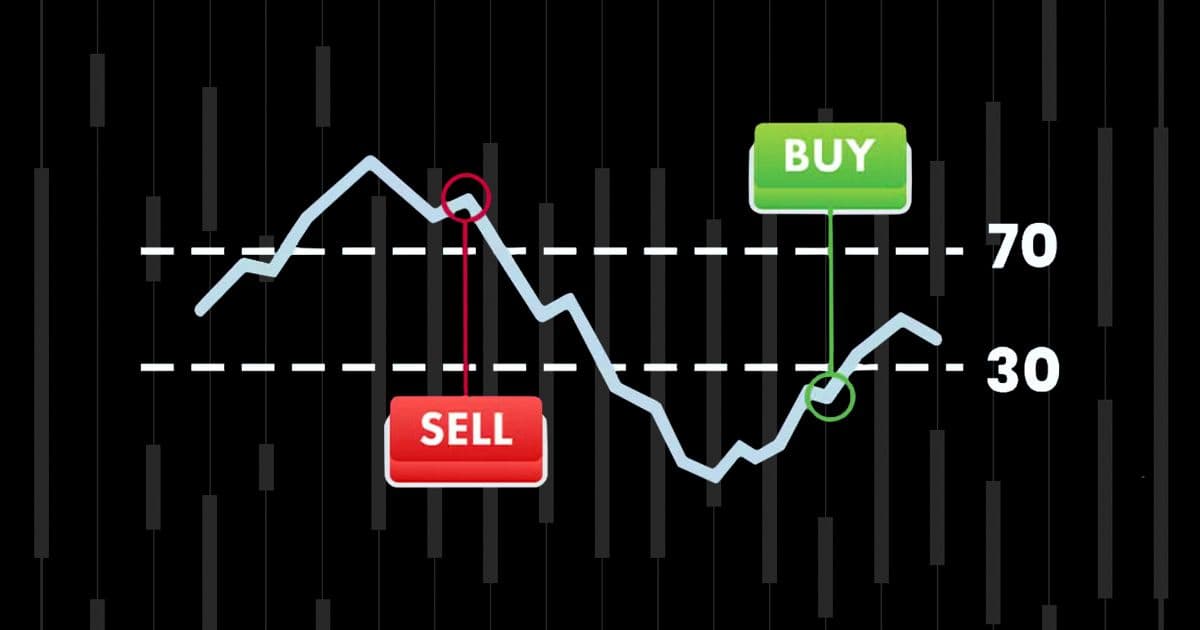
The Relative Strength Index (RSI) is one of the most popular momentum indicators. This indicator was developed by J. Welles Wilder, and it measures the speed and change of price movements. RSI ranges from 0 to 100. It helps you to see whether the asset is overbought or oversold.
If the RSI moves above 70, the asset is overbought. This is a signal that a correction may come. If the RSI is below 30, the asset is oversold. This means that the price may start to grow. This indicator may help you to determine entry and exit time. However, it is important to combine this indicator with other tools.
RSI can also help you to detect divergence. If the price forms higher highs but the RSI forms lower highs, it means that the momentum is weakening, and soon, a price reversal may come. And on the contrary, when the price makes lower lows, but RSI makes higher lows, it means that the price may start to grow. If you know these details, you can see the coming reversals and earn more.
This indicator can be used in all markets: forex, stocks, cryptocurrencies, etc. If you are a day-trader, you can use RSI to get short-term signals. If you are a swing trader, you may use it to detect medium-trend reversals. If you want to improve its reliability, we recommend to combine RSI with moving averages, such as MACD. This will help you to avoid premature entires and confirm the market direction.
RSI also can be used for different timeframes. For example, traders use mostly a 14-period RSI, but you can adjust it to a shorter period if you want to receive faster signals. And if you want to see smoother trends, we recommend to adjust it to a longer period.
RSI is very popular, but it doesn’t mean that it is 100% reliable. If the trend is strong, RSI can show overbought or oversold conditions for a very long time. This is why you shall combine it with other indicators.
MACD Indicator
The Moving Average Convergence Divergence (MACD) is a trend-following momentum indicator. It shows the relationship between two moving averages of the asset’s price. It is common to use the 12--period and 26-period exponential moving averages to calculate the MACD line, and a 9-period signal line is normally used for confirmation.
MACD helps identify changes in momentum, trend direction, and potential buy or sell signals. When the MACD line crosses above the signal line, it generates a bullish signal. It signals a potential upward momentum. When the MACD line crosses below the signal line, it generates a bearish signal and indicates that a downward movement may be approaching.
Traders also analyze MACD histograms. They represent the difference between the MACD line and the signal line. If the histogram bars grow, it means that the momentum is strong. If the histogram bars decrease, it means that the momentum declines. If there is a divergence between MACD and price, you can expect a trend reversal.
MACD is very versatile and can be used in different conditions. You can also use it for different timeframes. You can also combine it with other indicators, especially with RSI or support and resistance levels to make your trading even more accurate. For example, if you see a bullish MACD crossover, and it is confirmed with an RSI breakout above 50, you can consider it as a strong entry signal.
MACD is very efficient in trending markets but if there are sideway movements or the markets are choppy, it can give false signals. This is why you better use it in combination with trend analysis. You can also use MACD to measure the strength of trends. Check the distance between the MACD line and the signal line. If the distance is big, the trend is strong. But if the distance narrows, the trend is weak and there may come a reversal.
ADX Indicator
The Average Directional Index (ADX) measures the strength of a trend, regardless of its direction. The ADX indicator was developed by Welles Wilder. It helps you to see whether the market is trending or ranging. You shall know it to select the right strategy.
ADX values the range from 0 to 100. If the value is below 20, it means that the trend is weak, or there are sideway movements. If the value is above 40, the trend is strong. You can use ADX in combination with the +DI and –DI lines, which show trend direction. A +DI above –DI means that there is a bullish trend, and –DI above +DI means that the trend is bearish.
ADX can help you if you use a trend-following strategy. It helps to reduce false signals and boost profitability. Also, if you know that a strong trend started, you can benefit from the market momentum and exit your positions before the trend ends.
You can use this indicator in all markets, such as stock, forex, commodities, and crypto. It works for different timeframes, this is why day traders and swing traders also use it. We recommend you to combine this indicator with MACD, moving averages, or RSI to confirm the trend strength and boost your accuracy.