Fundamental Analysis

May 20, 2026 - 8 min

●●Intermediate

What Is a Trade War and the Global Economy Impact

What Is a Trade War and the Global Economy Impact

Global markets shift every time a tariff announcement lands. What is a trade war, and why does it keep reshaping economies? This article breaks down how trade wars start. You will see who benefits, who pays, and what market signals to watch when governments escalate.

Justin Freeman
Reviewed by:
Share

Trade Wars at a Glance: Key Facts and Figures

Here is what the numbers say before we get into the details.

  • Trade war: states impose tariffs on each other in retaliation cycles
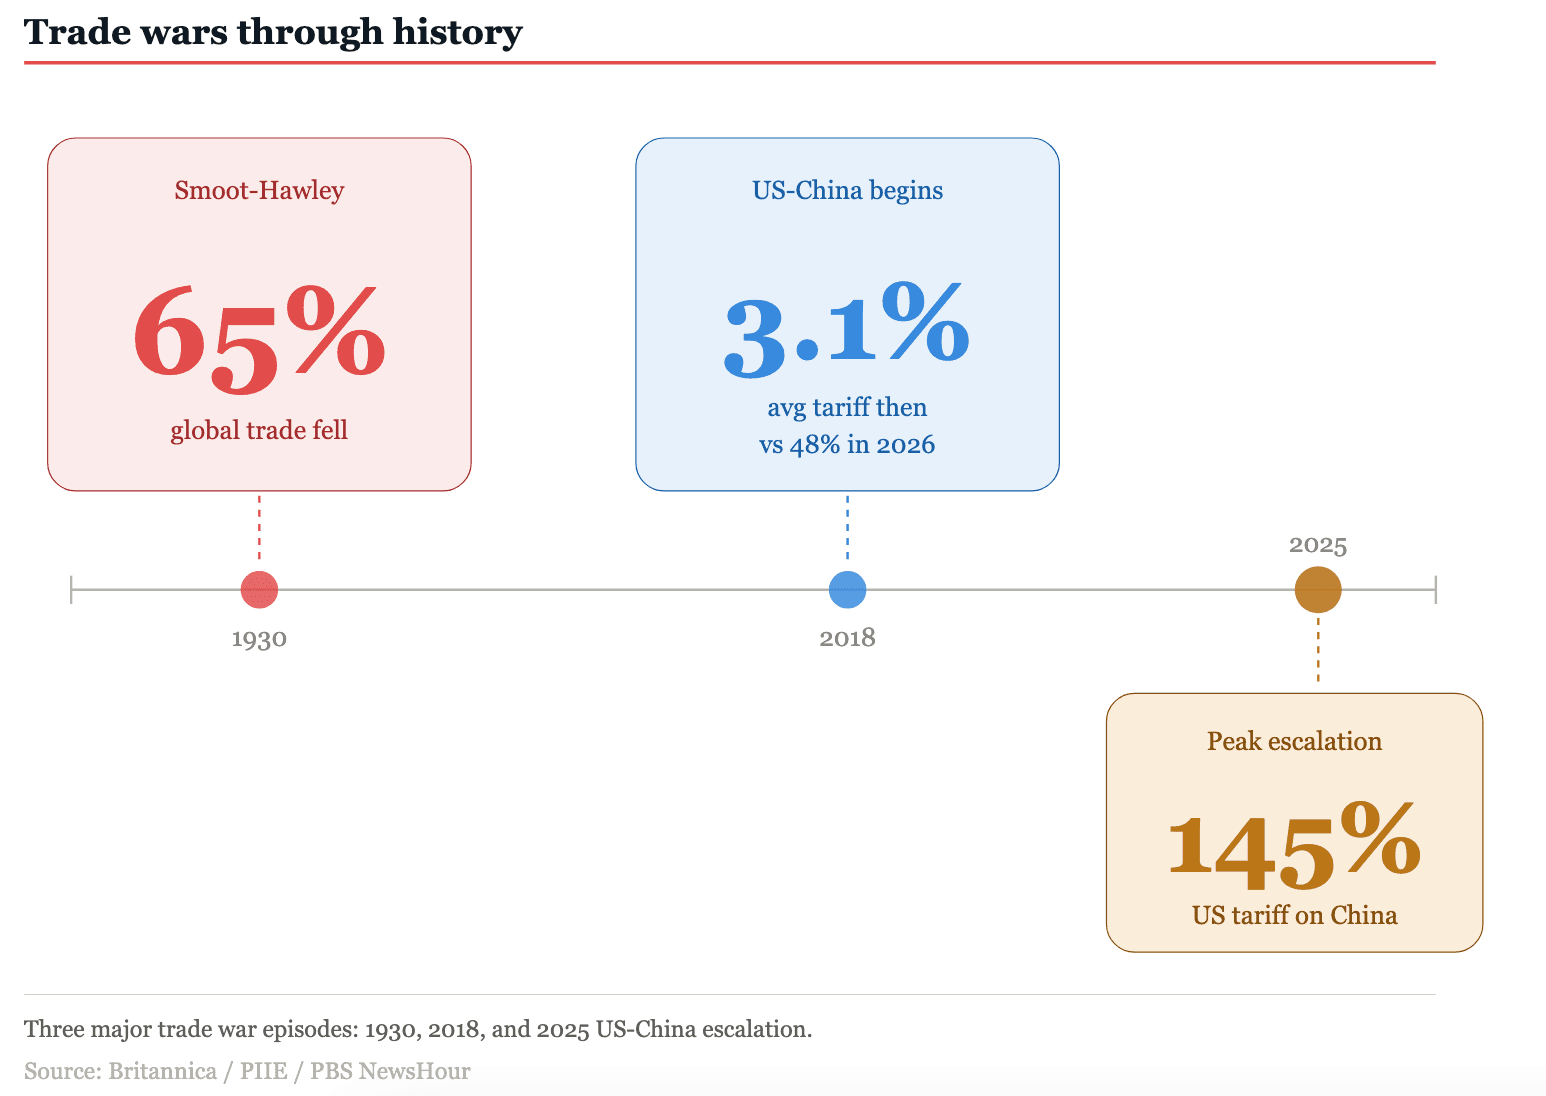
  • U.S. tariff on China, 2018: 3.1% average
  • U.S. tariff on China, 2026: ~48% average
  • Cost per U.S. household, 2026: $1,500 per year
  • Smoot-Hawley Tariff Act, 1930: global trade fell 65% in five years
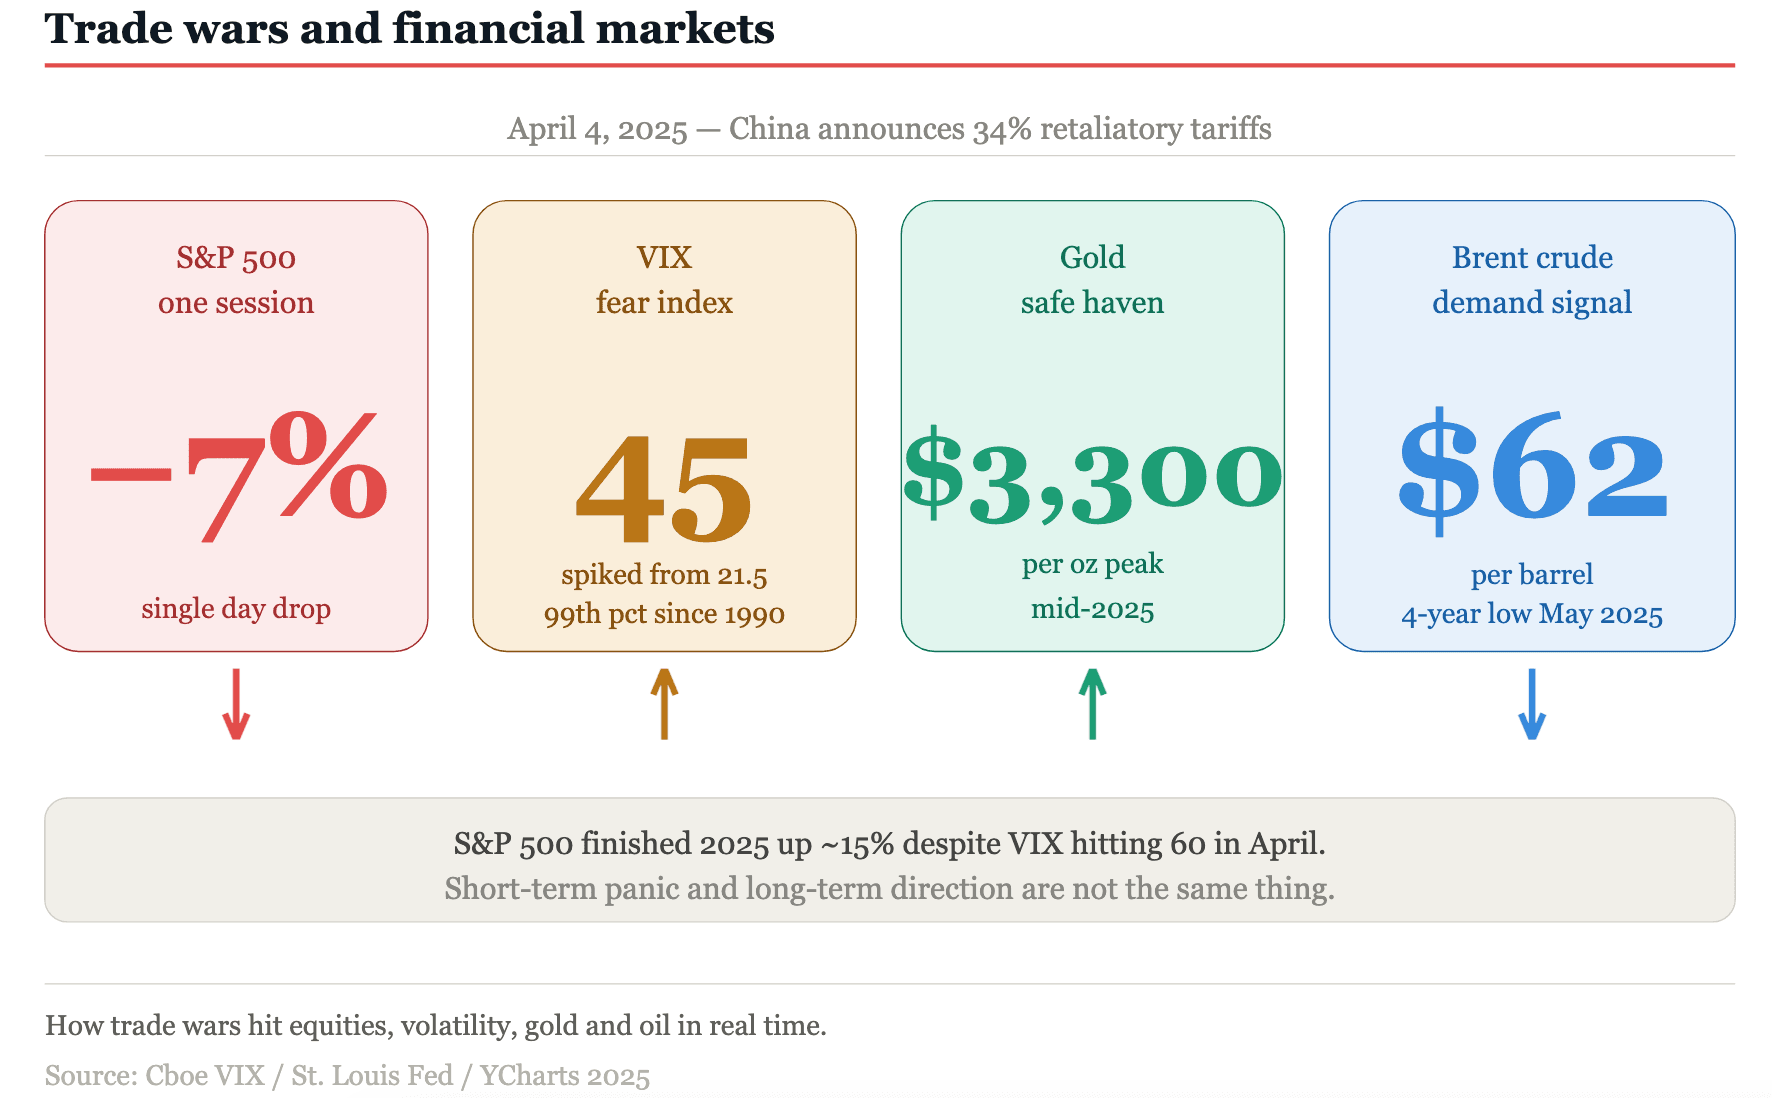
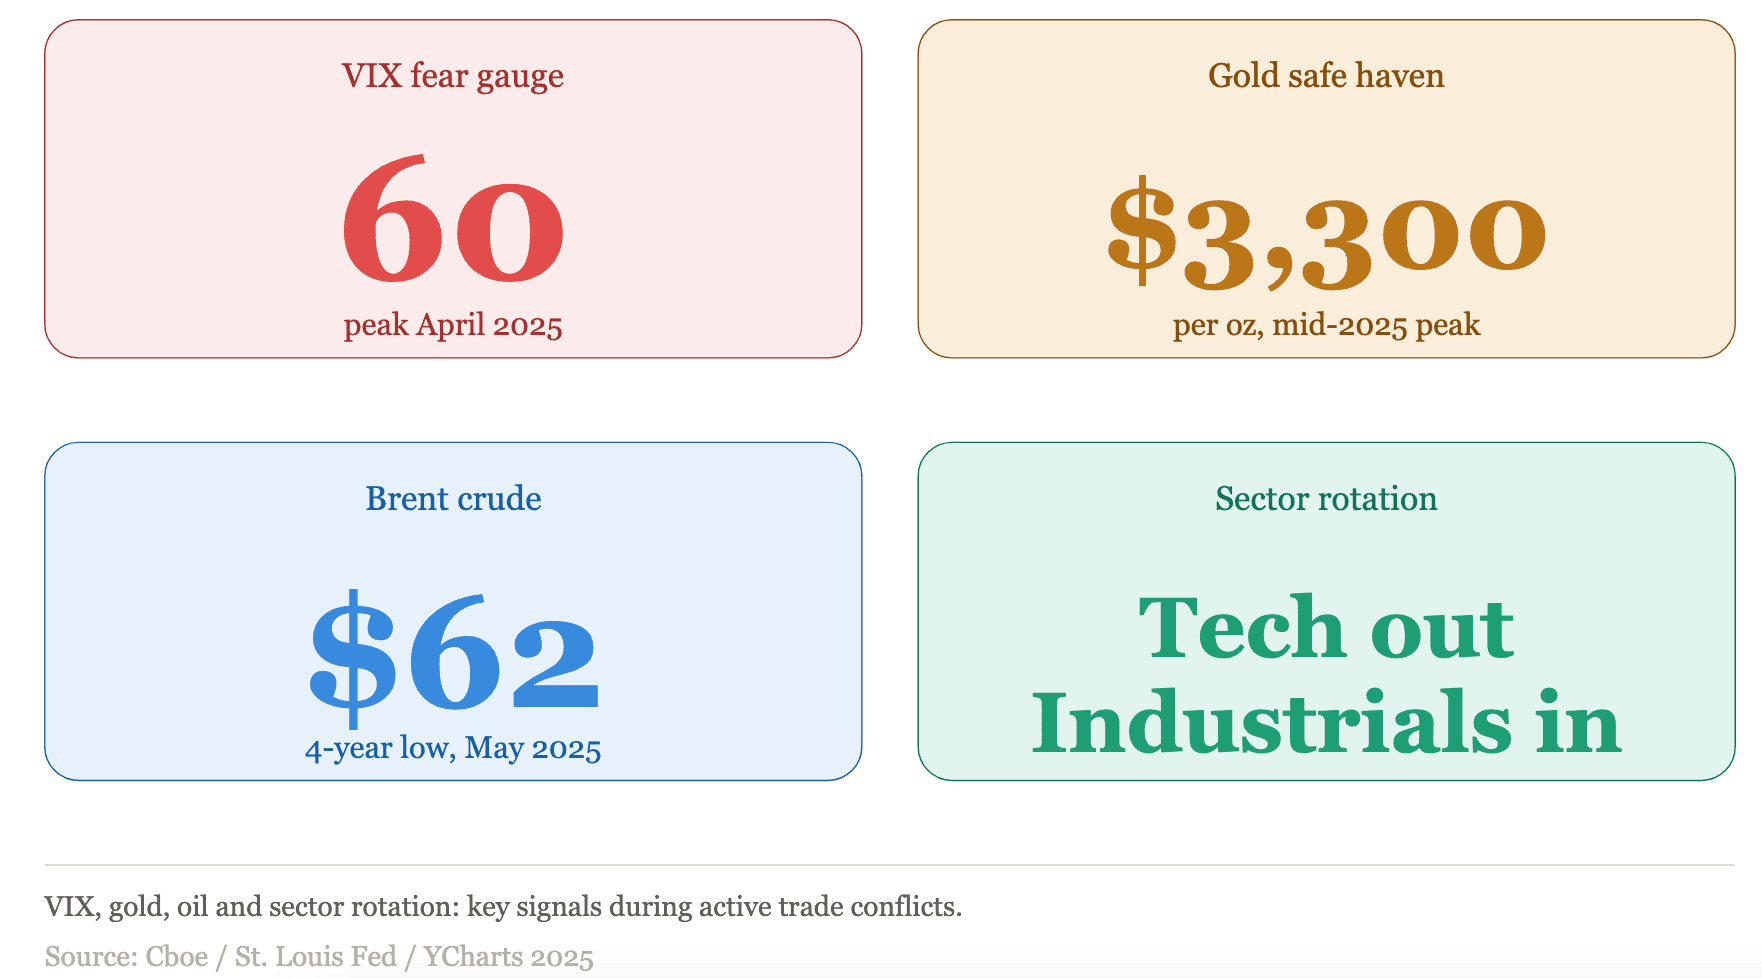
  • VIX, April 4, 2025: jumped from 21.5 to 45.3 after China retaliated

How Trade Wars Start and How They Escalate

How Trade Wars Start and How They Escalate

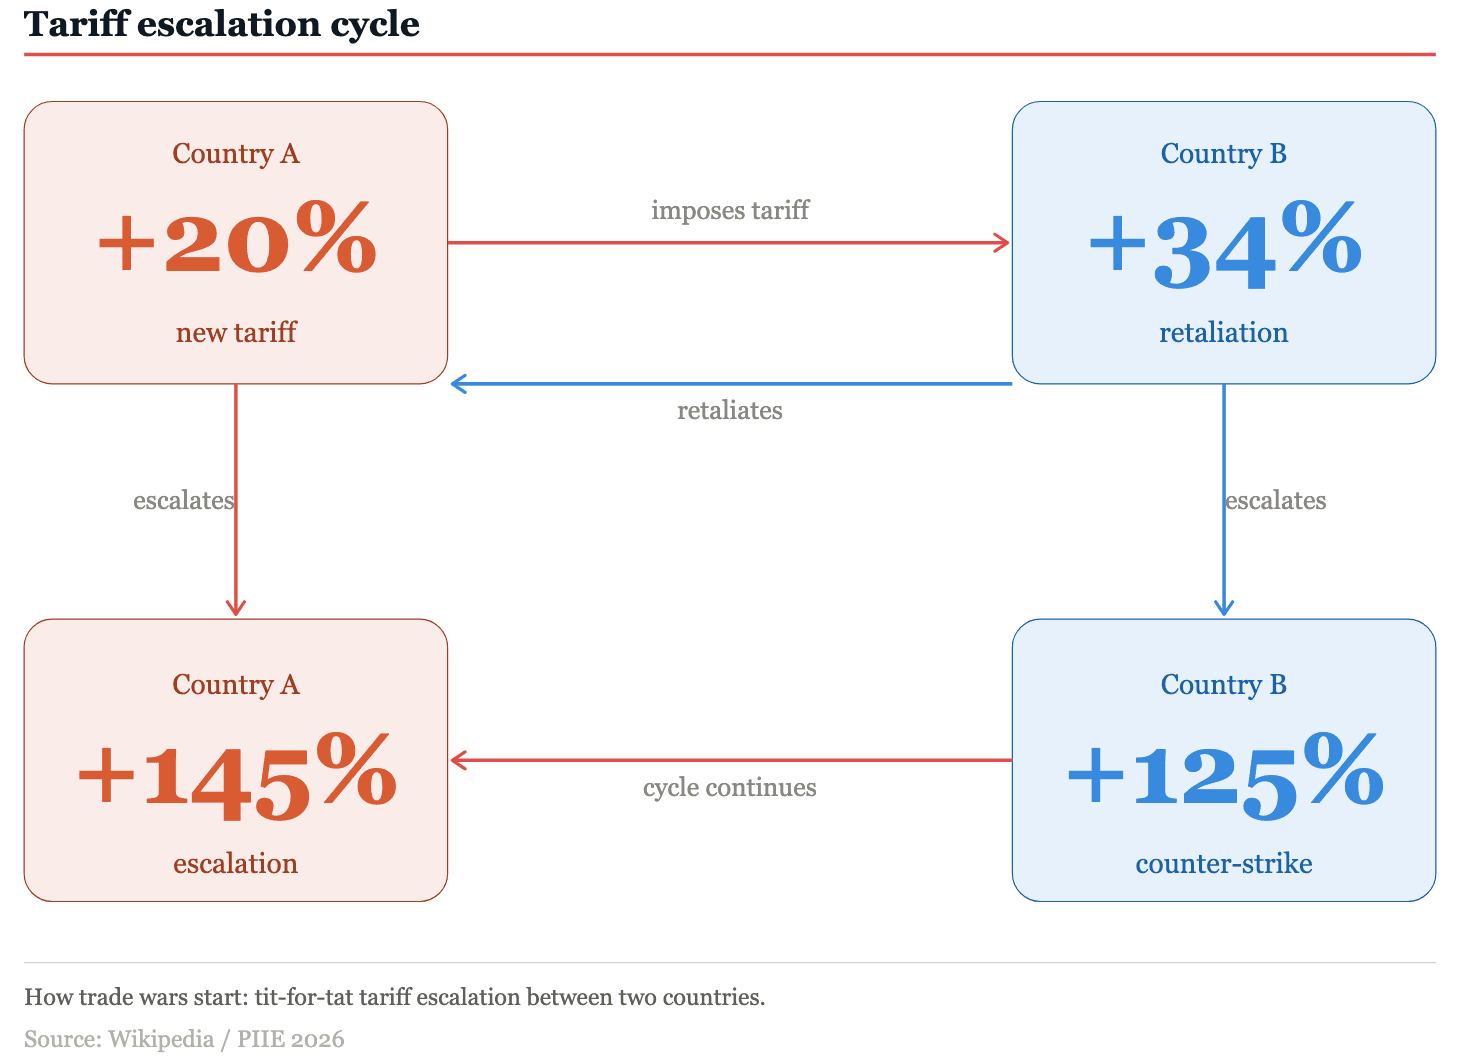
A trade war starts with one government decision. One country raises tariffs. The other retaliates. Then the first country responds again. That loop does not stop on its own. Governments restrict trade to protect domestic jobs, cut a trade deficit, or punish a partner for practices they consider unfair. 

“The problem is that retaliation is political. No government accepts new tariffs without a response.”

The Role of Tariffs, Quotas, and Trade Barriers

Tariffs are taxes on imported goods. They raise the price of foreign products and push buyers toward domestic alternatives. Trade barriers go further than tariffs alone.

Governments use four main tools in a trade conflict:

  • Tariffs: tax on imports
  • Quotas: cap on import volume
  • Export bans: block key materials
  • Subsidies: fund domestic producers

In 2025, China used all four simultaneously. It raised tariffs on U.S. goods, banned exports of rare-earth minerals, launched antitrust probes against U.S. technology firms, and threatened to restrict access to critical manufacturing inputs. U.S. automakers and electronics producers lost access to materials for which there were no ready domestic substitutes.

The Tit-for-Tat Cycle That Makes Trade Wars Dangerous

Each new tariff gives the other side political cover to respond. That structure is what makes trade wars so hard to exit. By April 2025, the U.S. had pushed tariffs on Chinese goods to 145%. China responded with a 125% tariff on U.S. products. 

At those levels, large categories of bilateral trade between the world's two biggest economies stopped. Supply chains that took decades to build broke apart in months. Leaders on both sides faced domestic audiences that read any concession as weakness.

Key takeaway: Trade wars follow a predictable structure. One government acts, the other retaliates, and each round makes exit harder. The tit-for-tat logic is stronger than the original policy goal. Every business and consumer on both sides pays for that dynamic.

3 Cases That Shaped Global Trade

3 Cases That Shaped Global Trade

Trade wars have repeated throughout modern history. Three episodes stand out because each began with a protective intent and ended with damage far beyond anyone's plan. Even though the scale differs, the logic is identical each time.

Smoot-Hawley (1930): When Protectionism Deepened a Depression

President Hoover signed the Smoot-Hawley Tariff Act on June 17, 1930. It raised tariffs on over 20,000 imported goods by an average of 20%. The goal was to protect American farmers during the early stages of the Great Depression.

Over 1,000 U.S. economists signed a letter urging Hoover to veto the bill. He signed it anyway. Around 25 countries retaliated. Global trade fell 65% between 1929 and 1934. U.S. imports from and exports to Europe dropped by more than two-thirds over three years. The act deepened the depression for every economy it touched.

Become a Confident Trader

Master trading with our structured course designed for beginners and intermediate traders.

Step-by-step lessons
Real strategies
Risk management training

Join 10,000+ traders improving their skills

Start Course Now

In 1934, Roosevelt reversed course with the Reciprocal Trade Agreements Act, cutting tariffs and restoring trade cooperation.

U.S.-China Trade War: A Timeline from 2018 to 2026

The U.S.-China trade war is the largest in modern history by the scale of the economies it involves. It began in 2018 and remains active in 2026. Let’s check year-by-year:

YearKey Event
2018Trump imposes first tariffs on China, citing IP theft.
2019Tariffs cover $350 billion in Chinese imports; China retaliates on $100 billion in U.S. exports.
2020Phase One trade agreement signed January 15; most tariffs remain.
2024Biden raises EV tariffs to 100% and semiconductor tariffs to 50%
2025Trump raises tariffs to 145%; China hits back at 125%; U.S. imports from China fall to 2009 levels.
2026Supreme Court strikes down IEEPA tariffs; U.S. tariff on China holds near 48%.

Before 2018, the average U.S. tariff on Chinese goods was 3.1%. By 2026, it sits at around 48%. That shift was built over eight years of escalation, failed deals, and renewed conflict.

Key takeaway: The Smoot-Hawley Tariff Act was designed to protect farmers and deepened a global depression. The U.S.-China conflict was designed to fix a trade deficit and disrupted supply chains on every continent. Trade wars consistently produce outcomes no government intended when it fired the first shot.

Who Benefits from Trade Wars and Who Pays the Price

Ask who benefits from trade wars, and the list is narrow. Ask who pays, and it covers most of the economy. Goldman Sachs was direct: tariffs help some domestic industries and hurt others, and the net effect on overall industrial output is negative.

Industries That Gain During Trade Conflicts

Domestic producers that compete directly with imports gain when foreign goods get more expensive. Buyers shift to local alternatives. Revenue improves in the short term.

Industries that gained during the 2025 trade conflict:

  • Domestic steel and aluminum producers
  • U.S.-based auto manufacturers
  • Oil and gas producers
  • Consumer staples with local supply chains

The Industrials Select Sector SPDR finished the first half of 2025 up nearly 12%, outpacing the broader S&P 500. Investors bet on reshoring and domestic demand shifting toward U.S. producers.

Consumers and Importers: The Real Cost

The cost lands hardest on consumers and on companies that depend on imported inputs. Tariffs move through supply chains and arrive at the end buyer as higher prices. The Tax Foundation put the 2026 cost at $1,500 per U.S. household. 

Technology hardware companies face the sharpest squeeze. Over 70% of the cost of goods sold in semiconductors and capital equipment comes from international sources. Tariffs on those inputs raise costs for every product that uses those components.

SectorPositionReason
Domestic steel producersWinnerForeign rivals priced out
Oil and gasWinnerDomestic supply, low import exposure
Consumer staples, local outputWinnerProtected margins, inelastic demand
Technology hardwareLoser70%+ supply chain sourced abroad
Agricultural exportersLoserRetaliation closes foreign markets
Import-dependent auto manufacturersLoserHigher parts costs compress margins
ConsumersLoserHigher prices across tariffed categories

Key takeaway: Trade wars create a narrow group of winners in protected industries and spread costs across the rest of the economy. The gains for steel producers are real. The losses for technology firms, farmers, and consumers are larger and hit more people. Every independent economic analysis confirms this split.

How Trade Wars Move Financial Markets

How Trade Wars Move Financial Markets

Financial markets price in trade war risk faster than the real economy does. A tariff announcement moves equities, currencies, commodities, and volatility indexes within hours.  

“Understanding which assets move and in which direction gives you a framework for navigating trade-driven volatility rather than reacting to each headline.”

Volatility, Supply Chains, and Asset Prices

The Cboe Volatility Index (VIX) is the clearest real-time measure of trade war fear. On April 4, 2025, after China announced retaliatory tariffs of 34%, the S&P 500 dropped 7% in a single session. The VIX spiked from 21.5 to 45.3. The St. Louis Fed placed that move in the 99th percentile of market shocks since 1990.

Commodities moved sharply in the same period. Gold surged above $3,300 per ounce as traders moved into safe-haven assets. Brent crude dropped to $62 per barrel in May 2025, a four-year low, as tariffs signaled slower global demand.

What Traders Watch During Trade Conflicts

What Traders Watch During Trade Conflicts

Active traders monitor specific signals during international trade disputes. These signals separate genuine economic repricing from short-term panic selling.

Key signals during active trade conflicts:

  • VIX above 30: elevated institutional fear
  • Yuan and euro vs. dollar: policy direction signals
  • Gold and oil: risk appetite in real time
  • Sector rotation: tech out, industrials in

The S&P 500 finished 2025 up approximately 15% despite the VIX hitting 60 during peak escalation in April. Markets overreact to individual announcements and then stabilize. Traders who know this hold their position logic through the noise.

Key takeaway: Trade wars generate predictable volatility sequences across equities, commodities, and currencies. The VIX, gold, and sector rotation all carry tradeable signals during escalation—the traders who perform best separate the structural shift from the short-term headline shock.

Wrapping It Up

A trade war is an economic conflict built on escalating tariffs and automatic retaliation. It starts with one government decision and grows through cycles that neither side can easily exit. History shows consistently that trade wars cause more damage than the imbalances they set out to fix.

Financial markets react before the real economy does, making trade policy one of the most immediate macro variables for active traders to track. The U.S.-China conflict that began in 2018 has reshaped global supply chains, relocated manufacturing across continents, and cost consumers on both sides hundreds of billions of dollars. It has not ended.

Frequently Asked Questions

Disclaimer: This article is for informational purposes only and does not constitute financial advice. Trading involves risk and may result in loss of capital.

Related Articles

The First Move Is Yours

Discover how Supertrade can transform your trading career. Explore challenges, access instant funding, and join a growing community of Supertraders.

Stay Ahead of the Game

Sign up to receive exclusive tips, market insights, and the latest updates from Supertrade. Don’t miss out on opportunities to grow your trading success.
Discord

Our Community

Do not skip any beat.

The Ultimate Trading Community. Join our Discord server to get the latest updates, news and more.

2026 Supertrade. All rights reserved
DiscordFacebookInstagramTelegramYouTubeXTikTok
Trading involves significant risk. Past performance is not indicative of future results. This is a simulated trading environment. Supertrade provides educational trading services.
Supertrade
Supertrade Ltd, a company incorporated under the laws of Saint Lucia with registered number 2024-00699, located at Ground Floor, Rodney Court Building, Rodney Bay, Gros Islet, Saint Lucia, LC01 101, operates and owns this website, as well as provides services under the Terms and Conditions posted on the website. Supertrade Prop Ltd, a company incorporated under the laws of England and Wales with registered number 16234284, located at 52-56 Standard Road, London, England, NW10 6EU, acting as a payment agent.