If you want to earn from trading, you need appropriate tools. While there are many tools that can be used, some of them help to understand price action better than others. Many traders still use traditional candlestick charts or line charts. However, these charts very often include a lot of market noise, and this doesn’t allow us to get a clear picture. However, the Renko chart helps to see all these trends in a new way. This chart type is more focused on price movement rather than time. This is how it differs from other charts, and this is why it shall be used if you want to have a clearer picture of the market.
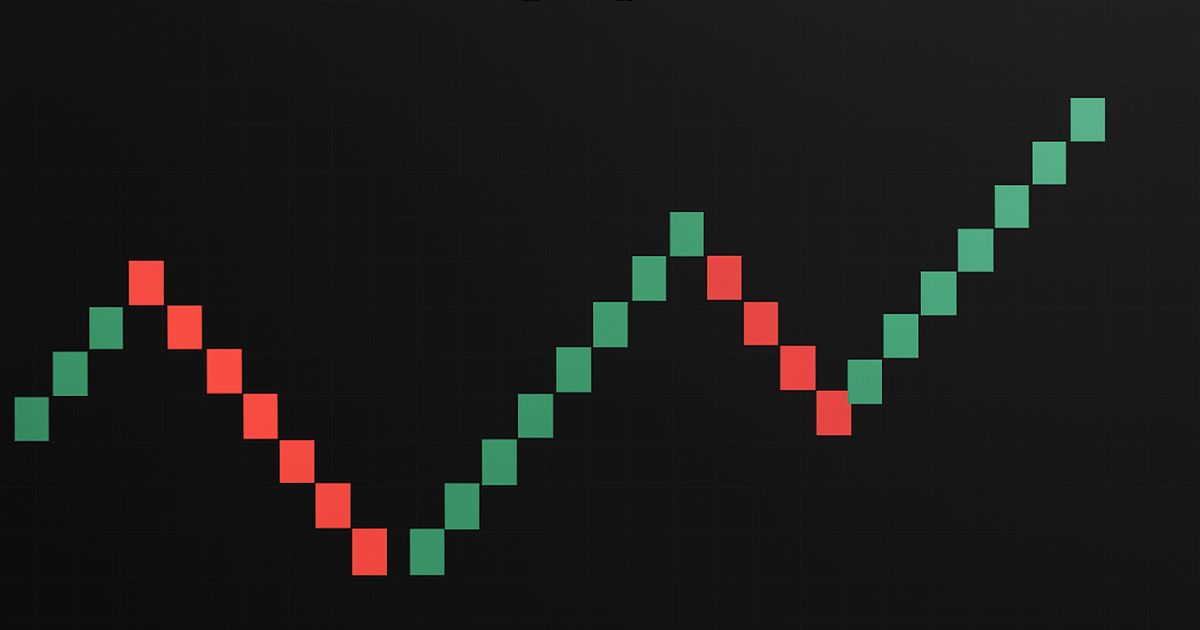
A Renko chart uses bricks instead of candlesticks. When the price moves by a specific amount, a new brick is formed. This approach is what differentiates the Renko chart from other charting methods. It helps traders to focus on significant price changes and not get distracted by smaller ups and downs.
This chart helps traders to detect clear trends. The Renko chart also helps to detect support and resistance levels because it does not consider random movements. With it, traders can trade more easily and make trading decisions more confidently.
Renko charts also reduce emotional pressure. Traditional charts often create uncertainty because they show every small move, and this is what makes traders more nervous. With the Renko chart, traders can only trade based on significant price changes.
Advantage of Renko Chart
The Renko chart offers some benefits that most traders like. The most important benefit is its ability to remove noise from the market. The Renko chart doesn’t show every tick or candle. It displays only those price changes that meet the chosen brick size. This helps traders see the bigger picture more clearly.
Another advantage is that this chart helps to identify the trend. Many traders find it difficult to see when a trend begins or ends. The Renko chart shows a series of bricks in the same direction, and it makes the trend more visible. If bricks continue to be formed upward, the trend is bullish. If they form downward, the trend is bearish. This makes it easier for traders to detect trends and trade with more confidence.
Renko charts also help to identify support and resistance levels. The chart highlights strong movements, this is why levels where the price repeatedly reverses become more obvious. Traders can use these zones to plan entries and exits with greater precision.
Another advantage is simplicity. The Renko chart does not rely heavily on complex indicators. Instead, it gives a visual representation that is easy to interpret. Many traders use Renko charts along with moving averages or oscillators to confirm signals. However, even if the Renko Chart is used alone, it can provide strong insights.
It is easier to manage risks with Renko charts. Because they filter out smaller moves, traders can place stop-loss orders at more logical levels. This helps to determine when random price spikes happen and not react to them.
So, the main advantages of a Renko chart are noise reduction, clear trend recognition, easier identification of support and resistance, and improved risk management. These strengths make the Renko chart a very comfortable tool that can be used by beginners and experienced traders.