

Technical Analysis

May 29, 2025 - 17 min

●●●Advanced

Updated: Jul 4, 2026

Fair Value Gap (FVG) Trading Explained with Real Chart Examples

Fair Value Gap (FVG) Trading Explained with Real Chart Examples

A fair value gap appears on your chart when price moves so fast that it skips entire price levels. These three candle imbalances reveal where institutional money pushed the market and where price is likely to return. This guide breaks down how to spot, grade, and trade FVGs across any market using a practical quality filter.

Evgenij Pakhomov
Reviewed by:
Share

Fair Value Gaps at a Glance: Key Facts

QuestionAnswer
What is a fair value gap?A three candle price pattern that marks an area where buying or selling pressure was so strong that the market skipped price levels entirely
Who created the FVG concept?Michael J. Huddleston, known as Inner Circle Trader (ICT), popularized fair value gaps as part of his Smart Money Concepts framework
Do all fair value gaps get filled?Research estimates 60% to 70% of FVGs see at least a partial retracement, while 30% to 40% remain unfilled permanently
What markets show FVGs?Forex, indices, crypto, and stocks all produce fair value gaps, with liquid markets showing the cleanest patterns
What timeframe works best?The 1 hour and 4 hour charts produce the most reliable FVGs for swing and intraday traders
Are FVGs the same as regular gaps?No. Regular gaps form between sessions. FVGs form during active trading when one side overwhelms the other

What Is a Fair Value Gap in Trading?

A price imbalance that forms during a rapid directional move creates what traders call a fair value gap. The market moves so aggressively in one direction that it leaves behind an area where almost no trading took place. This gap between candle wicks signals that the balance between buyers and sellers broke down temporarily.

Michael J. Huddleston, the trader behind the Inner Circle Trader (ICT) methodology, brought this concept into mainstream retail trading. He built the FVG framework as a core element of Smart Money Concepts (SMC). The idea builds on a simple principle. Large institutional orders displace price so quickly that the normal auction process fails, and the market must eventually return to fill that void.

The Three Candle Pattern Behind Every FVG

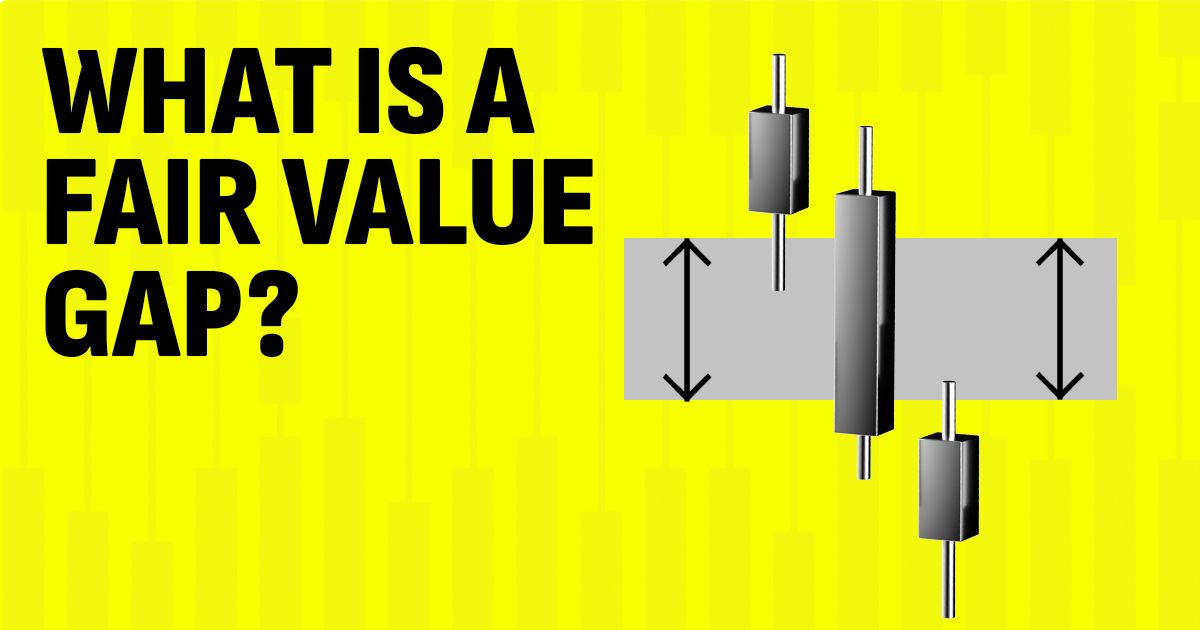
Every fair value gap forms across exactly three consecutive candles. The first candle sets up the move. The second candle is the displacement candle, a large body candle that drives price sharply in one direction. The third candle confirms the gap by not returning to overlap with the first candle's range.

The actual gap sits between the wick of candle one and the wick of candle three. In a bullish FVG, the high of candle one does not overlap with the low of candle three. In a bearish FVG, the low of candle one does not overlap with the high of candle three. If those wicks overlap, no gap exists.

Why Markets Leave Fair Value Gaps Behind

Large players like banks, hedge funds, and algorithmic trading systems move significant volume in short periods. When a bank executes a large buy order, it absorbs all available sell orders at the current price and pushes price upward rapidly. This creates a zone where few transactions took place.

The market tends to revisit these zones because unfilled orders still sit inside them. Market makers need liquidity to complete large client orders, and the FVG zone often holds resting orders that were never triggered. This pull toward the gap is what gives the pattern its predictive value. Research on H1 to H4 timeframes across major currency pairs confirms that price returns to most FVGs, though not all of them.

Key takeaway: A fair value gap is a three candle pattern that marks a price zone the market skipped during a strong move. Institutional buying or selling creates the imbalance, and unfilled orders inside the gap pull price back toward it. The concept was popularized by ICT as part of his Smart Money framework. Not every FVG fills, but the majority see at least a partial retracement.

Bullish vs Bearish Fair Value Gaps

The direction of the displacement candle determines whether an FVG signals buying or selling pressure. Bullish and bearish gaps create different trading opportunities and serve different roles in your market analysis. Understanding which type you are looking at changes how you plan your entry, stop, and target.

How a Bullish Fair Value Gap Forms

A bullish fair value gap appears when strong buying pressure drives price upward. The second candle in the pattern is a large green (or white) candle. The gap sits between the high of candle one and the low of candle three. No overlap exists between those two wicks.

This gap acts as a potential support zone. When price retraces downward and enters the bullish FVG, buyers often step back in. The expectation is that the same demand that created the gap will defend it when price returns.

How a Bearish Fair Value Gap Forms

A bearish fair value gap forms during aggressive selling. The second candle is a large red (or black) candle that displaces price sharply downward. The gap sits between the low of candle one and the high of candle three.

This gap acts as a potential resistance zone. When price rallies back up into a bearish FVG, sellers often re-enter the market. The supply that created the original drop tends to reject price a second time.

The table below compares the two types side by side.

FeatureBullish FVGBearish FVG
Displacement directionUpwardDownward
Gap locationBetween candle one high and candle three lowBetween candle one low and candle three high
Role when price returnsPotential support zonePotential resistance zone
Trade directionLong entries on pullbacksShort entries on rallies
InvalidationPrice closes below the bottom of the gapPrice closes above the top of the gap

Both types become invalid once price closes fully through the gap in the opposite direction. A broken bullish FVG is no longer a support zone, and a broken bearish FVG is no longer resistance.

Key takeaway: Bullish FVGs form during upward displacement and act as support when price returns. Bearish FVGs form during downward displacement and act as resistance. Each type has a clear invalidation level. Once price closes through the gap entirely, the pattern loses its relevance.

How to Identify a Fair Value Gap on Any Chart

Spotting these imbalances becomes straightforward once you know the exact structure. The process works on any asset and any timeframe. You need three consecutive candles and a gap between the wicks of the first and third.

Step by Step FVG Identification Process

Start by scanning your chart for a candle with a noticeably large body compared to its neighbors. This is your displacement candle (candle two). Now check the candle before it (candle one) and the candle after it (candle three).

Follow these steps to confirm the pattern.

  • Check candle two size
  • Compare candle one and three wicks
  • Confirm no overlap exists
  • Mark the gap zone
  • Extend the zone forward

If the high of candle one and the low of candle three do not overlap in an upward move, you have a bullish FVG. If the low of candle one and the high of candle three do not overlap in a downward move, you have a bearish FVG. Mark the gap with a rectangle and extend it to the right on your chart. This rectangle becomes your zone of interest for potential entries.

What Makes an FVG Valid vs Invalid

Not every three candle gap deserves your attention. A valid fair value gap needs context and structure behind it. An invalid one forms in noise and leads to poor trades.

A valid FVG should meet these conditions.

  • Forms with a clear trend
  • Creates a structural break
  • Has a clean, visible gap
  • Sits in a discount or premium zone

An FVG that forms inside a tight range with no trend is internal noise. It does not represent genuine institutional displacement. The strongest gaps form at the start of a new leg, where price breaks a recent swing high or swing low. These structural breaks confirm that the FVG carries real momentum behind it.

Key takeaway: Identify FVGs by finding a large displacement candle and checking for a gap between the first and third candle wicks. Valid FVGs form within a clear trend direction and create a break of structure. Gaps inside ranging markets are lower quality. Always confirm that the wicks do not overlap before marking a zone.

How to Grade FVG Quality Before You Trade

Most traders lose money on FVGs because they treat every gap the same. A quality filter separates the high probability setups from the traps. This section introduces a five point scoring system that no major competitor guide covers.


Become a Confident Trader

Master trading with our structured course designed for beginners and intermediate traders.

Step-by-step lessons
Real strategies
Risk management training

Join 10,000+ traders improving their skills

Start Course Now

The Five Point FVG Quality Filter

Score each FVG from 0 to 5 using the criteria below. A score of 4 or 5 signals a high probability setup. Anything below 3 is not worth the risk.

Quality FactorScore 1 Point If
Trend alignmentThe FVG forms in the direction of the current trend
Structural breakThe displacement candle triggers a break of structure (BOS) or change of character (CHoCH)
Premium or discount zoneA bullish FVG sits in the discount half of the range, or a bearish FVG sits in the premium half
Fresh and unmitigatedPrice has not returned to the gap since it formed
Volume confirmationThe displacement candle shows higher volume than the surrounding candles

Use the Fibonacci retracement tool to define premium and discount. Draw it from the swing low to the swing high of the current leg. Everything below the 50% level is discount. Everything above is premium. Buy in discount and sell in premium.

This filter aligns with the principles outlined in Smart Money Concepts (SMC) methodology, where trend, structure, and zone confluence create the highest win rates.

Premium and Discount Zones as a Quality Gate

The premium and discount model adds a simple layer of risk control. If you buy a bullish FVG that sits in the premium zone (above the 50% level), you are buying high. That trade carries higher risk because price already moved significantly in your favor before you entered.

Restricting bullish entries to discount and bearish entries to premium eliminates a large number of poor setups. Research across major forex pairs on H1 to H4 timeframes shows that FVGs in the correct zone produce risk to reward ratios between 1 to 3 and 1 to 5, even with win rates around 45%.

Key takeaway: Grade every FVG before you trade it using a five point quality filter. The best setups score 4 or 5, combining trend alignment, a structural break, the correct zone, fresh status, and volume. Skipping the filter and trading every gap is the fastest way to lose money on this strategy.

How to Trade Fair Value Gaps with Real Examples

Knowing what is a fair value gap is only the first step. You need a clear plan for entries, stops, and targets. The entry method you choose depends on how aggressive or conservative you want to be.

Entry at the FVG Edge vs Consequent Encroachment

Most traders place limit orders at the edge of the FVG. In a bullish setup, that means placing a buy order at the top of the gap zone. This is the conservative approach. Price must travel all the way to the edge before your order fills.

A more precise method uses consequent encroachment (CE), which is the 50% midpoint of the gap. In strong trends, price often retraces only to the midpoint before reversing. Waiting for a full fill can mean missing the move entirely.

Calculate CE by measuring the distance between the top and bottom of the gap and dividing by two. Place your limit order at that midpoint. This approach provides a tighter stop loss and a better risk to reward ratio.

A practical fair value gap example from EUR/USD on the 1 hour chart illustrates this. Price created a bullish FVG during a London session breakout, retraced to the CE level within the New York session, printed a rejection candle, and continued higher for over 60 pips.

Stop Loss and Take Profit Placement for FVG Trades

Place your stop loss beyond the opposite edge of the FVG. For a bullish FVG entry, set the stop just below the bottom of the gap. For a bearish FVG entry, set the stop just above the top of the gap.

Target the next unmitigated FVG in the opposite direction, or the next significant swing high or low. Many traders use a fixed risk to reward ratio of 1 to 2 or 1 to 3 as a minimum.

FVG Trading on Different Timeframes

Higher timeframes produce stronger FVGs. The 4 hour and daily charts show gaps created by institutional order flow that can hold for days or weeks. Use these for directional bias.

Lower timeframes like the 15 minute and 5 minute charts help you refine your entry. After identifying a 1 hour FVG, drop to the 15 minute chart and wait for a change of character (CHoCH) inside the gap zone. That CHoCH acts as your confirmation trigger.

This top down approach combines macro direction with micro precision. Start with the daily or 4 hour chart to find the gap, then use a lower timeframe to time the entry.

Key takeaway: Trade FVGs using either the edge or the consequent encroachment midpoint for entries. Place stops beyond the opposite side of the gap. Use higher timeframe FVGs for direction and lower timeframe CHoCH signals for precise entries. This multi timeframe approach improves accuracy and risk to reward.

Fair Value Gap Performance Across Markets

Not all markets treat FVGs equally. Liquidity, session structure, and volatility determine how reliably these gaps get filled. The data below draws from published testing across forex pairs, indices, and crypto on multiple timeframes.

FVG Fill Rates by Asset Class and Timeframe

Research on H1 to H4 timeframes across major forex pairs found that most FVGs confirm the existing trend direction. Broader analysis estimates that 60% to 70% of all FVGs see at least a partial retracement.

MarketTimeframeEstimated Partial Fill RateNotes
Major forex pairs (EUR/USD, GBP/USD)H1 to H465% to 70%Highest reliability due to deep liquidity and 24 hour trading
US indices (NQ, ES)H1 to H460% to 70%Strong during New York session, weaker during low volume overnight periods
Bitcoin and major cryptoH1 to H455% to 65%Weekend gaps and thin order books reduce reliability
Small cap stocksDaily50% to 60%Low liquidity creates frequent false signals

These numbers reflect partial fills, not complete gap fills. A partial fill means price enters the gap zone but does not necessarily travel through the entire zone.

Where FVGs Work Best and Where They Fail

FVG in trading works best in liquid, trending markets during active sessions. Major forex pairs during London and New York overlap produce the cleanest setups. US index futures during the New York cash session show strong results, especially around the 10 AM to 11 AM ET window that ICT traders call the Silver Bullet window.

FVGs fail most often in ranging, low volume conditions. Crypto markets during weekends and holidays produce lower quality gaps. Small cap stocks with thin order books create frequent FVGs that never fill because the imbalance was not institutional.

Key takeaway: FVGs perform best in liquid, trending markets with active institutional participation. Major forex pairs and US index futures on H1 to H4 timeframes show the highest fill rates. Crypto and small cap stocks produce lower reliability. Always match your FVG trades to the right market conditions.

Inverse Fair Value Gaps and When They Matter

An inverse fair value gap (IFVG) forms when price breaks through an existing FVG instead of respecting it. This concept is one of the more advanced elements in the ICT framework, and it changes how you interpret a gap that appears to have failed.

How an FVG Flips Into an Inverse FVG

When price closes through a bullish FVG to the downside, that former support zone flips into potential resistance. The original buyers were overwhelmed, and the sellers who pushed through now control the zone. The same logic applies in reverse. A bearish FVG that gets broken to the upside becomes potential support.

The key requirement is a candle body close beyond the gap. A wick poking through the gap does not count as a valid inversion. Only a full body close confirms the flip.

Trading the IFVG as Support or Resistance

After the flip, wait for price to retrace back to the broken gap. The original zone now acts in the opposite direction. Look for rejection candles at or near the IFVG boundary before entering.

For example, if a bullish FVG on EUR/USD at 1.0850 to 1.0870 gets violated by a bearish candle closing below 1.0850, that zone now becomes resistance. If price later rallies back to 1.0850, you watch for a bearish rejection candle and enter short with a stop above 1.0870.

IFVGs work best after a liquidity sweep, where price takes out a swing high or low before reversing. They also gain strength when they align with a higher timeframe premium or discount zone.

Key takeaway: An inverse FVG forms when price closes through an existing gap, flipping its role. Bullish gaps become resistance after a bearish breakout, and bearish gaps become support after a bullish breakout. Confirm the inversion with a candle body close, not just a wick. Trade the retest with confirmation and a tight stop.

Common Fair Value Gap Mistakes That Cost Traders Money

Even experienced traders make predictable errors with FVGs. Most mistakes come from skipping the filtering process or ignoring the bigger picture. Avoiding these errors improves your results faster than learning new setups.

Trading Every Gap Without Context

The most common mistake is treating every three candle gap as a trade signal. Charts are full of FVGs, especially on lower timeframes. Most of them form inside consolidation ranges and carry no real institutional intent. Trading without a quality filter turns this strategy into a losing system.

A standard automated FVG bot tested across 300 trades showed a win rate of only 29%. The bot treated every gap as a signal and lacked any context filter. Applying the five point quality filter from this guide eliminates most of those losing trades before they happen.

Ignoring Market Structure and Trend Direction

Trading a bullish FVG inside a strong downtrend fights the dominant order flow. The same applies to bearish FVGs during uptrends. Structure and trend must come first. Identify your break of structure and change of character levels before you even look for FVGs.

Other frequent errors include trading mitigated (already visited) gaps, entering at the wrong zone (buying in premium), and using FVGs on illiquid assets with thin order books. Each of these reduces your edge and turns a high probability setup into a coin flip.

Key takeaway: The biggest FVG mistakes are trading every gap, ignoring trend direction, and skipping the quality filter. Automated bots without context filters show dismal results. Structure and trend always come before the gap itself. Apply the five point filter and restrict entries to fresh, unmitigated gaps in the correct zone.

Key Takeaways: What You Need to Know About Fair Value Gap Trading

A fair value gap is a three candle imbalance where price moves so fast it skips levels, marking a zone the market is likely to revisit. The concept comes from the ICT methodology and forms a core part of Smart Money Concepts. Grade every FVG before trading it using trend alignment, structural breaks, premium and discount zones, fresh status, and volume confirmation. The strongest setups score 4 or 5 on the quality filter and appear in liquid markets during active sessions.

Frequently Asked Questions

Disclaimer: This article is for informational purposes only and does not constitute financial advice. Trading involves risk and may result in loss of capital.

Related Articles

The First Move Is Yours

Discover how Supertrade can transform your trading career. Explore challenges, access instant funding, and join a growing community of Supertraders.

Stay Ahead of the Game

Sign up to receive exclusive tips, market insights, and the latest updates from Supertrade. Don’t miss out on opportunities to grow your trading success.
Discord

Our Community

Do not skip any beat.

The Ultimate Trading Community. Join our Discord server to get the latest updates, news and more.

2026 Supertrade. All rights reserved
DiscordInstagramTelegramYouTubeX
Trading involves significant risk. Past performance is not indicative of future results. This is a simulated trading environment. Supertrade provides educational trading services.
Supertrade
Supertrade Ltd, a company incorporated under the laws of Saint Lucia with registered number 2024-00699, located at Ground Floor, Rodney Court Building, Rodney Bay, Gros Islet, Saint Lucia, LC01 101, operates and owns this website, as well as provides services under the Terms and Conditions posted on the website. Supertrade Prop Ltd, a company incorporated under the laws of England and Wales with registered number 16234284, located at 52-56 Standard Road, London, England, NW10 6EU, acting as a payment agent.