
Black Swan Events at a Glance: Key Facts Every Trader Should Know
The core data before reading further:
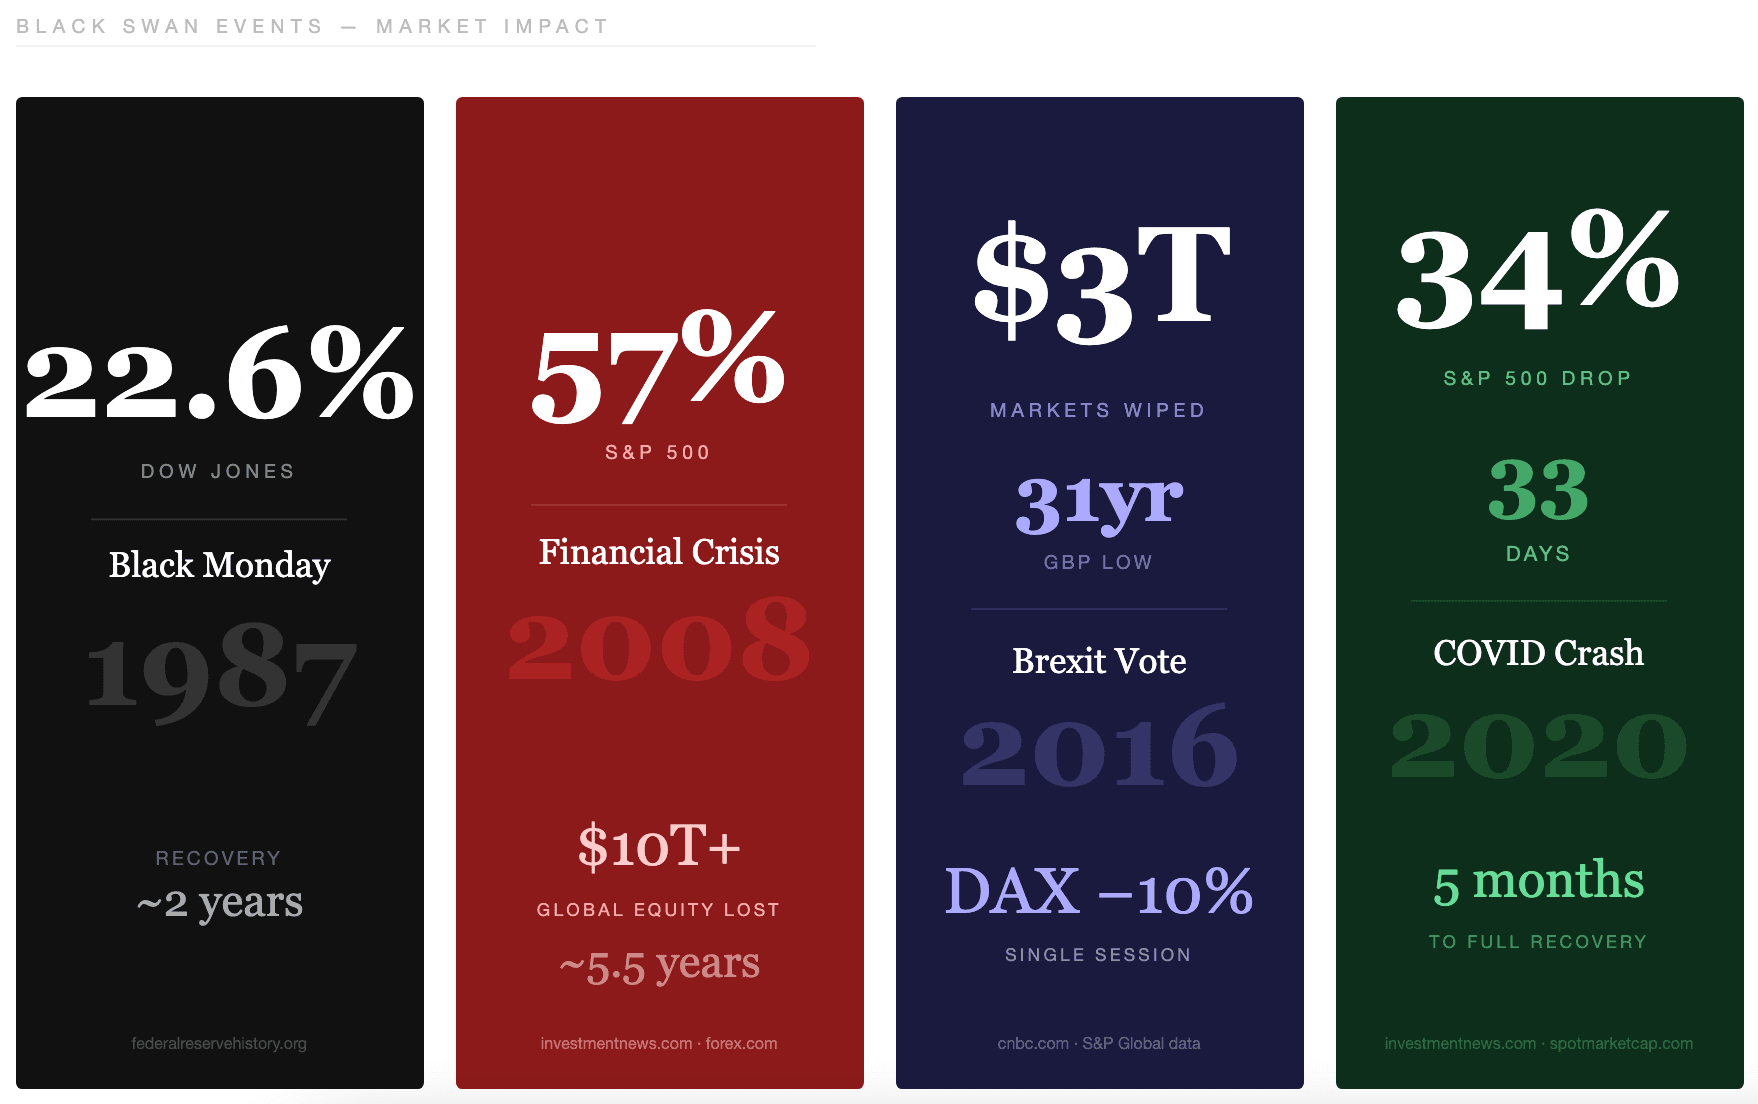
- The Dow Jones fell 22.6% in a single day on October 19, 1987
- The S&P 500 dropped 57% from peak to trough during the 2008 crisis
- Brexit erased over $3 trillion in global market value in two trading sessions
- The S&P 500 fell 34% in 33 days during the COVID crash of 2020
- The NASDAQ took 13 years to recover its dot-com bubble peak
- Nassim Taleb introduced the concept in his 2007 book "The Black Swan"
Each number marks a moment where standard risk models got it completely wrong.
What Is a Black Swan Event
A black swan event sits far outside what any model or institution expects. It lands with consequences large enough to reshape entire systems. Nassim Nicholas Taleb argued in his 2007 book that markets consistently underestimate extreme outcomes. He was a former Wall Street trader. You cannot rely on historical data to prepare for events without historical precedent.
"Most risk models assume tomorrow will resemble yesterday. Black swans exist precisely because that assumption is wrong."
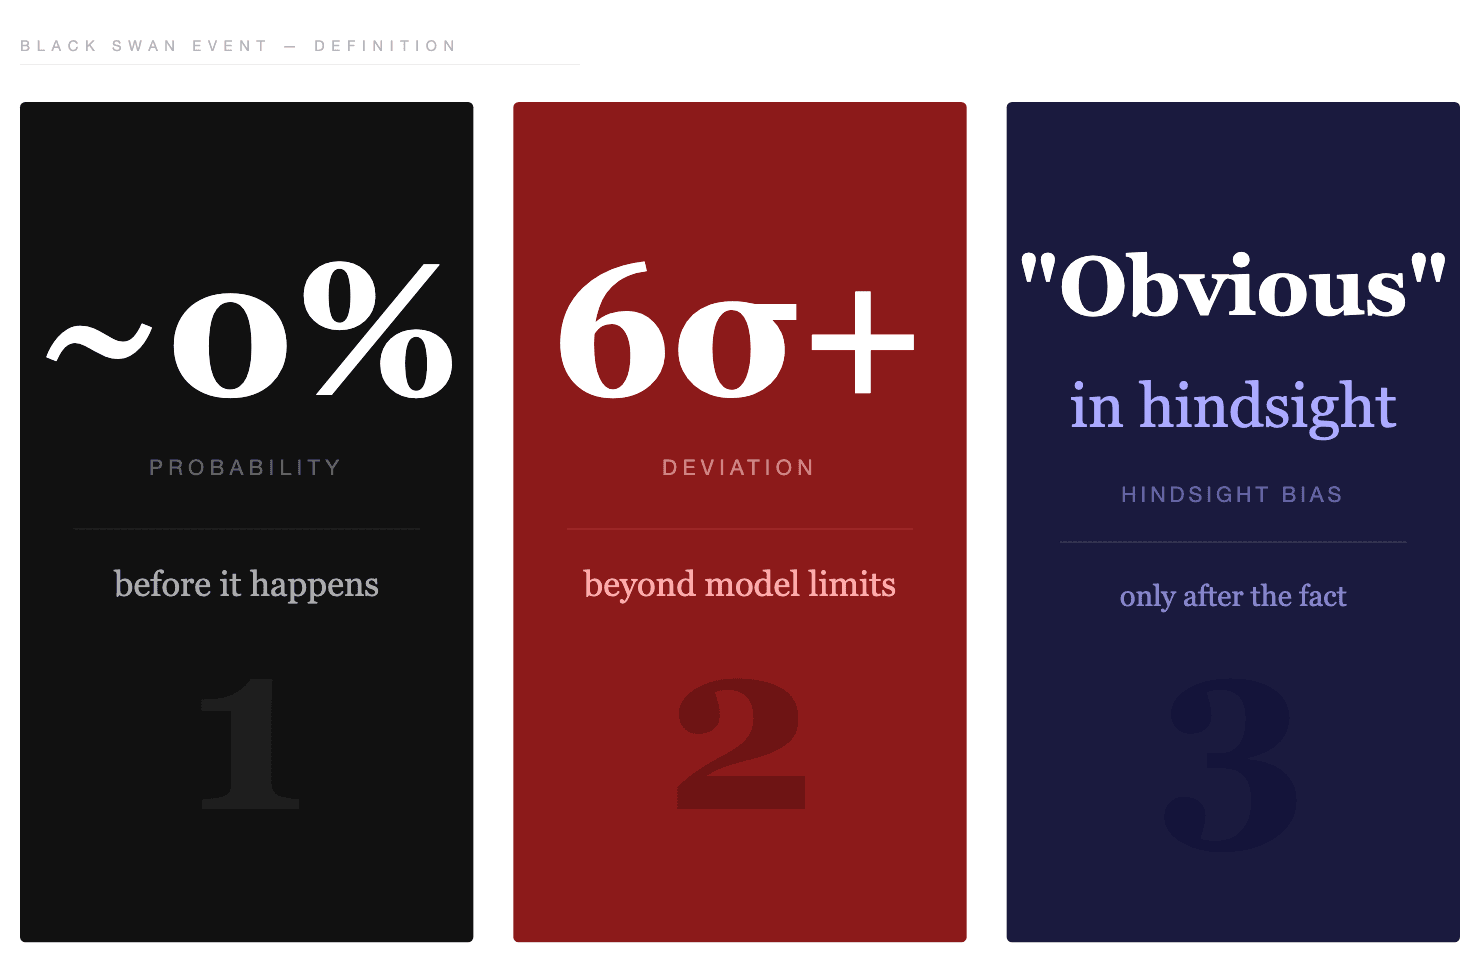
The Three Defining Characteristics
Taleb identified three features that separate a true black swan from an ordinary market shock. Every confirmed black swan event shares all three:
- Extreme rarity before it happens
- Catastrophic impact when it lands
- Obvious explanation only in hindsight
The third point is where traders get hurt twice. First, the event destroys value. Then, experts explain why it was inevitable all along. That narrative creates false confidence that the next shock will arrive with warning. It will not.
Black Swan vs Grey Swan vs White Swan
Not every unexpected event qualifies as a black swan. The distinction shapes how you build a risk strategy. A grey swan is a low-probability event that analysts can at least imagine. Major earthquakes, cyberattacks, or regional banking failures all qualify. A white swan is a near-certain event that most people ignore because the timing remains unclear.
Taleb argued COVID-19 was a white swan. Virologists had warned of exactly this type of pandemic for years. A black swan sits entirely outside what any model or prior experience can anticipate.
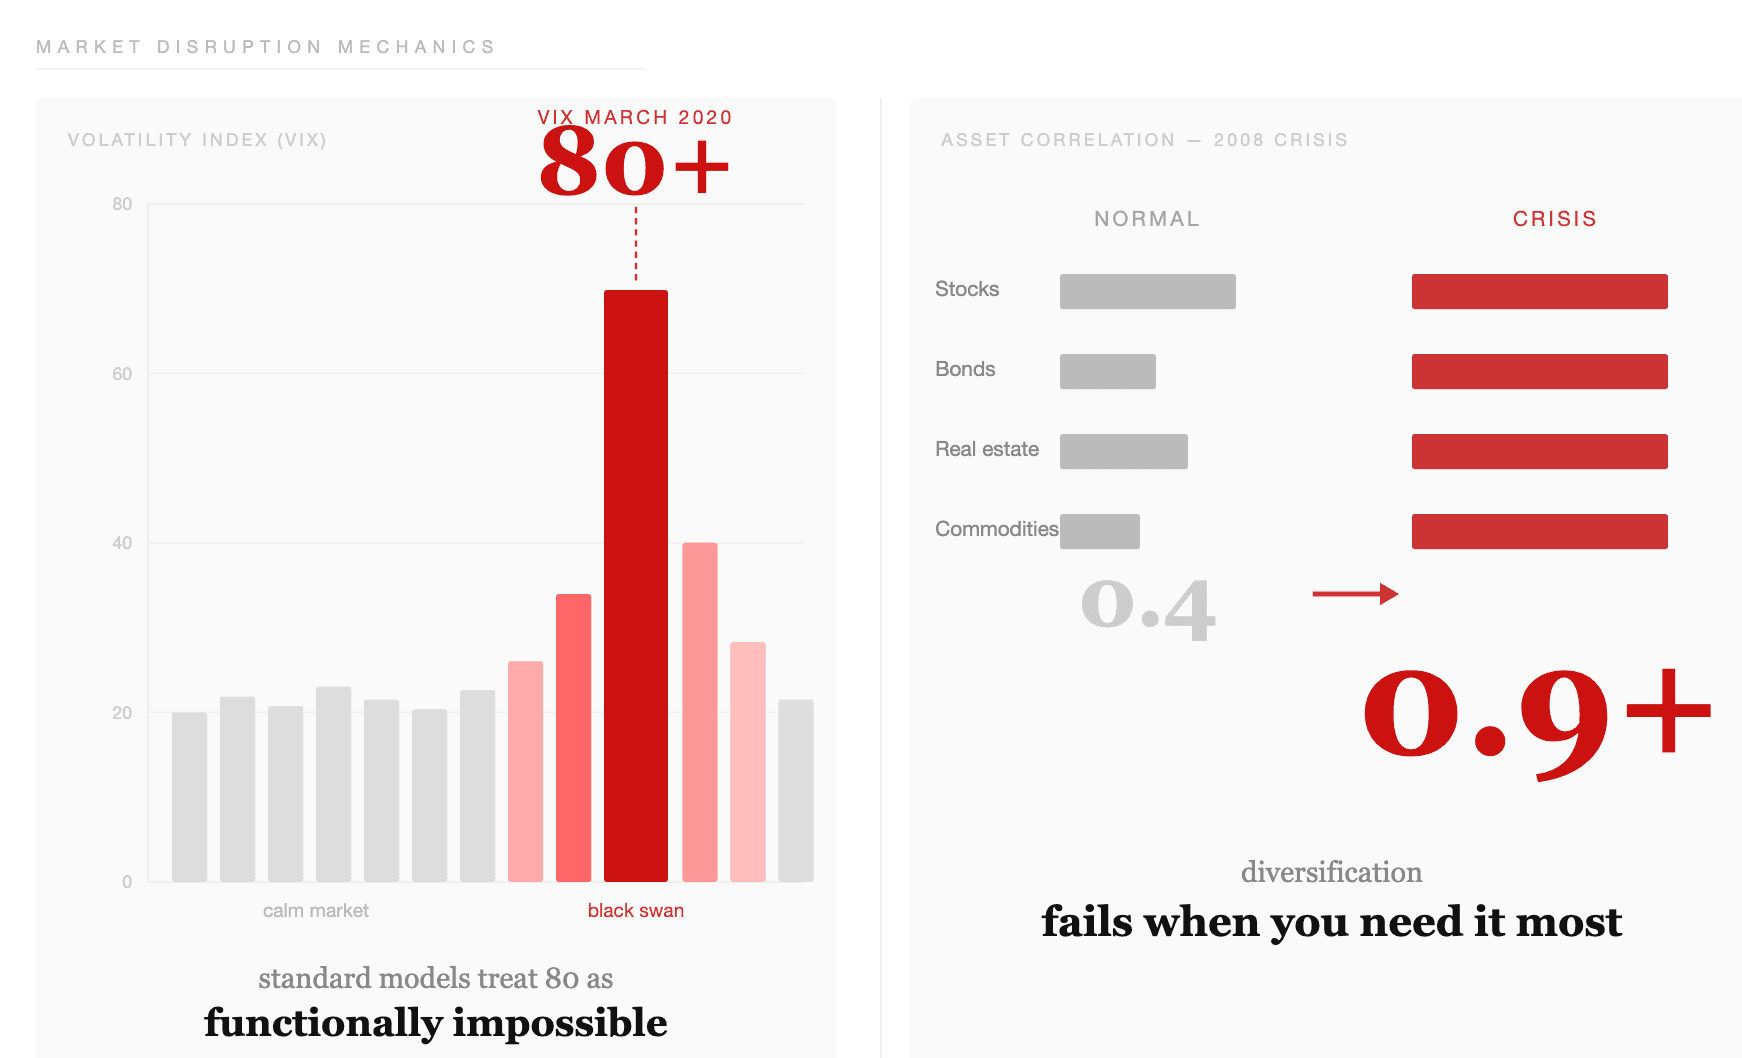
Why Normal Distribution Models Miss Extreme Events
Standard financial models assume returns follow a bell curve. Under that assumption, a six-standard-deviation move should rarely occur in a human lifetime. Markets produce those moves regularly. Financial returns follow fat-tailed distributions.
“Extreme outcomes appear far more often than a normal curve predicts.”
Taleb described this as the difference between Mediocristan, where averages dominate, and Extremistan, where single rare events drive total outcomes. Gaussian models leave you blind to the events that matter most.
Key takeaway: A black swan is an event that existing models cannot assign a meaningful probability to. Grey and white swans carry different risk profiles you can plan for. Black swans require a fundamentally different approach.
Black Swan Event Examples That Reshaped Financial Markets
The history of markets includes a small number of events that fall into a different category from ordinary crashes. Each black swan event example below permanently changed how traders, regulators, and institutions think about risk. Speed, scale, and source of shock exceeded anything markets had priced in.
Black Monday 1987: 22.6% in One Day
On October 19, 1987, the Dow Jones Industrial Average fell 22.6%. That remains the largest single-day percentage drop in its history. The NYSE lost over $500 billion in market capitalization that session.